Unlock a world of possibilities! Login now and discover the exclusive benefits awaiting you.
- Qlik Community
- :
- Forums
- :
- Analytics
- :
- New to Qlik Analytics
- :
- Sotring 2-dimensional bar chart
- Subscribe to RSS Feed
- Mark Topic as New
- Mark Topic as Read
- Float this Topic for Current User
- Bookmark
- Subscribe
- Mute
- Printer Friendly Page
- Mark as New
- Bookmark
- Subscribe
- Mute
- Subscribe to RSS Feed
- Permalink
- Report Inappropriate Content
Sotring 2-dimensional bar chart
Hi all!
Please help me to sort a 2-dimensional bar chart in QSense:

Dim1 - 1st dimension.
Dim2 - 2nd.
2nd dimension has 3 different values: high, average, low.
Count(Dim2) is used to get values for a chart (measure).
1) I need to sort 1st dimension - based on total count of Dim2's of each Process
2) And I need to sort bars inside each process as follows:
left bar - high
middle bar - average
right bar - low
RandomData:
Load * Inline [
ID, Dim1, Dim2
1, Process1, high
2, Process1, high
3, Process1, high
4, Process1, average
5, Process1, average
6, Process1, average
7, Process1, high
8, Process1, low
9, Process1, low
10, Process1, high
11, Process2, high
12, Process2, high
13, Process2, low
14, Process2, average
15, Process3, average
16, Process3, average
17, Process3, high
18, Process3, low
19, Process3, low
];
Thanks!
- Mark as New
- Bookmark
- Subscribe
- Mute
- Subscribe to RSS Feed
- Permalink
- Report Inappropriate Content
It sounds like using "Y-Value", Descending order of sorting should solve your needs. If it's not working as expected, I suggest posting a little sample of your app and someone can help you make it work as you need.
Cheers,
Oleg Troyansky
Upgrade your Qlik skills at the Masters Summit for Qlik - coming soon to Munich, Germany!
- Mark as New
- Bookmark
- Subscribe
- Mute
- Subscribe to RSS Feed
- Permalink
- Report Inappropriate Content
OK here it is... the file is attached.
- Mark as New
- Bookmark
- Subscribe
- Mute
- Subscribe to RSS Feed
- Permalink
- Report Inappropriate Content
Ah, this is Qlik Sense... Wrong forum 🙂
In Qlik Sense, here is your solution:
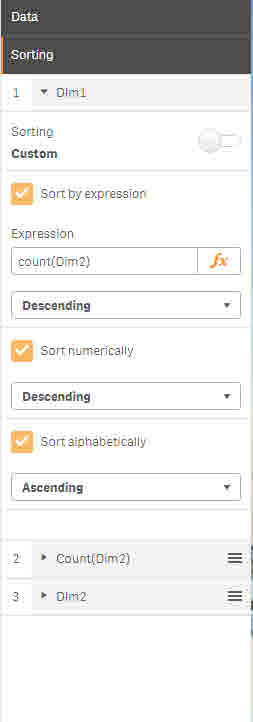
1. Dim1 should be the first in Sorting, sorted by Expression count(Dim2), Descenting
2. The Measure should be the second in sort order, also Descending.
Attaching the updated sample.
- Mark as New
- Bookmark
- Subscribe
- Mute
- Subscribe to RSS Feed
- Permalink
- Report Inappropriate Content
not quite the result I need....
I need:
1. Sort Dim1 based on total (sum) of values of Dim2 in each Dim1 - accomplished.
2. Sort bars inside each Dim1 as follows (not accomplished😞
left bar - 'high'
middle bar - 'average'
right bar - 'low'
3. Also (new question) it would be great to use the exact colors in this example, but use this red for 'high' bars; this yellow for 'middle' bars, and this blue for 'low' bars
Please, help me to figure out how to make it.....
- Mark as New
- Bookmark
- Subscribe
- Mute
- Subscribe to RSS Feed
- Permalink
- Report Inappropriate Content
Ah, sorry, I misread your requirement...
In QlikView, you could sort by Load Order, but unfortunately you can't do it in Sense... Preferably, I'd load "high", "average", and "low" as dual values with numbers behind each value. In that case they would sort nicely. Otherwise, you can construct a conditional expression with 2 nested IF statements. It's a bit ugly, but does the job. See attached.
If you'd like to play with colors, explore the Colors settings under Appearance - you can color by expression and do something similar there.
cheers,
Oleg Troyansky
Upgrade your Qlik skills at the Masters Summit for Qlik - coming soon to Munich, Germany!