Unlock a world of possibilities! Login now and discover the exclusive benefits awaiting you.
- Qlik Community
- :
- Forums
- :
- Analytics
- :
- New to Qlik Analytics
- :
- histogram and count
- Subscribe to RSS Feed
- Mark Topic as New
- Mark Topic as Read
- Float this Topic for Current User
- Bookmark
- Subscribe
- Mute
- Printer Friendly Page
- Mark as New
- Bookmark
- Subscribe
- Mute
- Subscribe to RSS Feed
- Permalink
- Report Inappropriate Content
histogram and count
I'm trying to create a histogram with data that looks like this
MICRO NAME PEOPLE Per MICRO
micro a 5
micro b 1
micro c 8
micro x 3
micro y 10
micro z 2
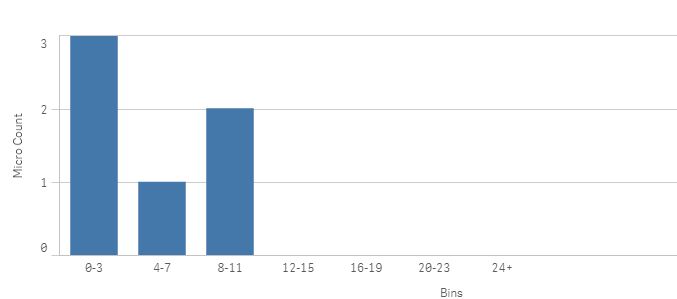
with the below data I'd like to display the bars based on the bins below,
there are 3 micros that have between 0-3 people per micro
there is 1 micro that has between 4-7 people per micro
there are 2 micros that have between 8-11 people per micro
how would I tweak the Count(Sum(Aggr(If(Sum([Planned Hours]) > 0, 1, 0), [Pva Micro], [Pva Emp Name]))) statement to test those conditions?
IF
(
ValueList('0-3','4-7','8-11','12-15','16-19','20-23','24+') = '0-3', Count(Sum(Aggr(If(Sum([Planned Hours]) > 0, 1, 0), [Pva Micro], [Pva Emp Name]))),
IF
(
ValueList('0-3','4-7','8-11','12-15','16-19','20-23','24+') = '4-7', ....
- Mark as New
- Bookmark
- Subscribe
- Mute
- Subscribe to RSS Feed
- Permalink
- Report Inappropriate Content
so, basically, it would be count all of the macros that have between 0 and 3 people
count all of the macros that have between 4 and 7 people..
I just can't get the syntax.
- Mark as New
- Bookmark
- Subscribe
- Mute
- Subscribe to RSS Feed
- Permalink
- Report Inappropriate Content
So if I get your requirement correctly, do you want a bar chart like this
Then one way to do this is,
Dimension : =ValueList('0-3','4-7','8-11','12-15','16-19','20-23','24+')
Mesures :
=if(
ValueList('0-3','4-7','8-11','12-15','16-19','20-23','24+')='0-3',count({<[PEOPLE Per MICRO]={"<4"}>}[MICRO NAME]),
if(ValueList('0-3','4-7','8-11','12-15','16-19','20-23','24+')='4-7',count({<[PEOPLE Per MICRO]={">3<8"}>}[MICRO NAME]),
if(ValueList('0-3','4-7','8-11','12-15','16-19','20-23','24+')='8-11',count({<[PEOPLE Per MICRO]={">7<12"}>}[MICRO NAME]))
))
- Mark as New
- Bookmark
- Subscribe
- Mute
- Subscribe to RSS Feed
- Permalink
- Report Inappropriate Content
my only issue is that <[PEOPLE Per MICRO]> is not an actual loaded value...it's a calculated measure using this
Sum(Aggr(If(Sum([Planned Hours]) > 0, 1, 0), [Pva Micro], [Pva Emp Name]))
so what would the syntax be for this?
would it be something like this?
Count({$(Sum(Aggr(If(Sum([Planned Hours]) > 0, 1, 0), [Pva Micro], [Pva Emp Name])))={"<4"}}($Sum(Aggr(If(Sum([Planned Hours]) > 0, 1, 0), [Pva Micro], [Pva Emp Name]))))
- Mark as New
- Bookmark
- Subscribe
- Mute
- Subscribe to RSS Feed
- Permalink
- Report Inappropriate Content
I've tried all kinds of expressions..
Count({{(Sum(Aggr(If(Sum([Planned Hours]) > 0, 1, 0), [Pva Micro], [Pva Emp Name])))}={"<4"}}Aggr(Sum(Aggr(If(Sum([Planned Hours]) > 0, 1, 0), [Pva Micro], [Pva Emp Name])), [Pva Micro]))
Help! I just don't understand the syntax. how do I program with the calculated measure?!
- Mark as New
- Bookmark
- Subscribe
- Mute
- Subscribe to RSS Feed
- Permalink
- Report Inappropriate Content
I'm losing my mind here... I tried this below. I just do not understand how to get what I'm looking for.
The Sum(Aggr(If(Sum([Planned Hours]) > 0, 1, 0), [Pva Micro], [Pva Emp Name]) expression creates a field that can be summed to calculate people per macro. how can I use that formula to calculate the histogram distribution of the count of macros containing between 0-3 people, count of macros containing 4-7 people...etc.
what do I need to do to tweak this statement?
Count(aggr(Sum(Aggr(If(Sum([Planned Hours]) > 0, 1, 0), [Pva Micro], [Pva Emp Name]))={"<4"}) [Pva Micro]),
i feel like I'm close..i'm just not understanding something, obviously..
here is a snapshot of the histogram charting calcs that I'm attempting. I'm sure that there's a much better way to do this. I'm completely new to this..
IF
(
ValueList('0-3','4-7','8-11','12-15','16-19','20-23','24+') = '0-3', Count(aggr(Sum(Aggr(If(Sum([Planned Hours]) > 0, 1, 0), [Pva Micro], [Pva Emp Name]))={"<4"}) [Pva Micro]),
IF
(
ValueList('0-3','4-7','8-11','12-15','16-19','20-23','24+') = '4-7', Count(aggr(Sum(Aggr(If(Sum([Planned Hours]) > 0, 1, 0), [Pva Micro], [Pva Emp Name]))={">3<8"} [Pva Micro]),
....
)
)
- Mark as New
- Bookmark
- Subscribe
- Mute
- Subscribe to RSS Feed
- Permalink
- Report Inappropriate Content
Hmm I'm not sure whether this can be achieved using value lists.
But if you're interested in class interval bar graph, my suggestion is to play around with the class function.
Dimension : =class(aggr(Count({<[Planned Hours] = {'>0'}>}[Pva Emp Name]), [Pva Macro]),2,'-')
Measure : Count(distinct [Pva Macro])