Unlock a world of possibilities! Login now and discover the exclusive benefits awaiting you.
- Qlik Community
- :
- All Forums
- :
- QlikView App Dev
- :
- Selección condicional de gráficos en base a un Niv...
- Subscribe to RSS Feed
- Mark Topic as New
- Mark Topic as Read
- Float this Topic for Current User
- Bookmark
- Subscribe
- Mute
- Printer Friendly Page
- Mark as New
- Bookmark
- Subscribe
- Mute
- Subscribe to RSS Feed
- Permalink
- Report Inappropriate Content
Selección condicional de gráficos en base a un Nivel Inicial
Good Morning,
I have 2 doubts relationships:
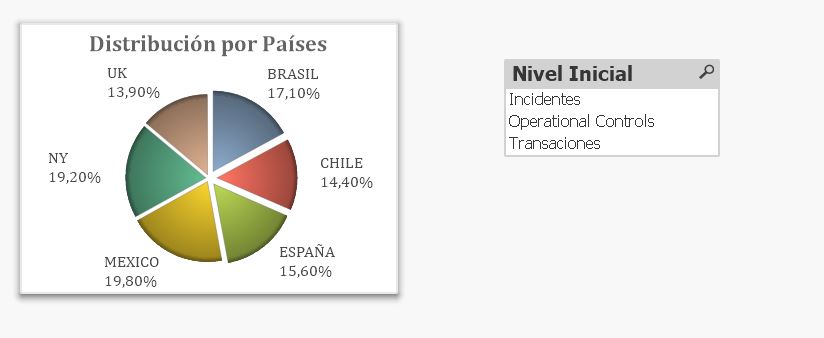
The following graphic is created with the Initial Level (countries) dimension and with the expression Dual ([Level 1] & Chr (10) & num (sum (Operations) / sum (Total) , # 0% '), sum (Operations)).
- I only want this graphic to appear when you select in the list box on the right, the transactions field.
- On the other hand, I want to use that same pie chart, so when you select the field incidents, the distribution of incidents by country. Anybody can help me?
- Mark as New
- Bookmark
- Subscribe
- Mute
- Subscribe to RSS Feed
- Permalink
- Report Inappropriate Content
1.- Utiliza la condición de visualización (right click > Chart properties > Layout > Show > Condition) con una expresión del estilo
GetSelectedCount([Nivel Inicial]) > 0
2.- Hay varias formas de hacerlo, la más sencilla es que Nivel Inicial sea parte del análisis de conjuntos de forma que la expresión sea algo como
Sum(Importe)/Sum(TOTAL Importe)
Donde "Importe" está relacionado con el campo [Nivel Inicial]. Dicho de otra forma, en lugar de tener las cantidades en el campo "Operaciones", tenerlas en un campo Importe, y añadir en la tabla de hechos un campo Tipo o Nivel que corresponda con Incidentes, Operaciones o Transacciones.
La forma más compleja y peor para el rendimiento es crear una expresión condicional de forma que
If([Nivel Inicial] = 'Incidentes', Sum(Incidentes) / Sum(TOTAL Incidentes),
If([Nivel Inicial] = 'Operational Controls', Sum(Operaciones) / Sum(TOTAL Operaciones),
etc.
No recomiendo esta segunda forma.
- Mark as New
- Bookmark
- Subscribe
- Mute
- Subscribe to RSS Feed
- Permalink
- Report Inappropriate Content
Sunny in your example you full number is 12 thousand 3 hundred 45,68 and you're online adding a point in thounsands.
The format that I need is in your case 12,34 because is 12 thousand 3 hundred fourty.
In math term I have the whole number 12.345.675,45 and I need to divide by 1.000 ( 1 thounsand) = 12.345,67
Thanks in advance!