Unlock a world of possibilities! Login now and discover the exclusive benefits awaiting you.
- Qlik Community
- :
- All Forums
- :
- QlikView App Dev
- :
- Show totals in Bar graph
- Subscribe to RSS Feed
- Mark Topic as New
- Mark Topic as Read
- Float this Topic for Current User
- Bookmark
- Subscribe
- Mute
- Printer Friendly Page
- Mark as New
- Bookmark
- Subscribe
- Mute
- Subscribe to RSS Feed
- Permalink
- Report Inappropriate Content
Show totals in Bar graph
Hello everyone,
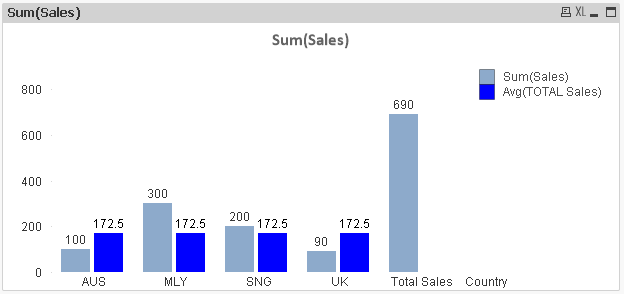
There are two expressions and one dimension in my bar graph. Is it possible to show a single bar at the end which calculates and displays the TOTAL for one expression and doesn't display for the other expression?
I would like to see something like in attached picture (Totals).
If not, is it at least possible to show TOTAL for just red bar and neglect the one that has constant values through out (as in picture, Totals2)?
Thank you.
- Mark as New
- Bookmark
- Subscribe
- Mute
- Subscribe to RSS Feed
- Permalink
- Report Inappropriate Content
Dimension Limit tab-> enable 'Show Total'
- Mark as New
- Bookmark
- Subscribe
- Mute
- Subscribe to RSS Feed
- Permalink
- Report Inappropriate Content
Hi Tresesco,
I have tried that, if I enable "Show Total" option, then it would calculate total for both expressions and then display total for both blue and red bars which I don't want. I would just like to see the sum calculated for the red bar expression and not for the blue bar. For blue bar, the value is constant and I would like to keep that same value in totals as well. Is that possible?
Thank you.
- Mark as New
- Bookmark
- Subscribe
- Mute
- Subscribe to RSS Feed
- Permalink
- Report Inappropriate Content
One way could be playing with background/text color like:
- Mark as New
- Bookmark
- Subscribe
- Mute
- Subscribe to RSS Feed
- Permalink
- Report Inappropriate Content
Hello,
Yes, this is a possible solution. But the only problem is, as the scale increases, length of other bars are reduced. I will check if I can change this. Will wait for few more replies and see. Anyways thank you for your suggestion and quick response.