Unlock a world of possibilities! Login now and discover the exclusive benefits awaiting you.
- Qlik Community
- :
- Forums
- :
- Analytics
- :
- New to Qlik Analytics
- :
- How to accentuate a region in pie chart
- Subscribe to RSS Feed
- Mark Topic as New
- Mark Topic as Read
- Float this Topic for Current User
- Bookmark
- Subscribe
- Mute
- Printer Friendly Page
- Mark as New
- Bookmark
- Subscribe
- Mute
- Subscribe to RSS Feed
- Permalink
- Report Inappropriate Content
How to accentuate a region in pie chart
Hello!
I have a pie chart with benchmarks, and I want to show the exact position of specific company in that benchmark.
I have something like this:
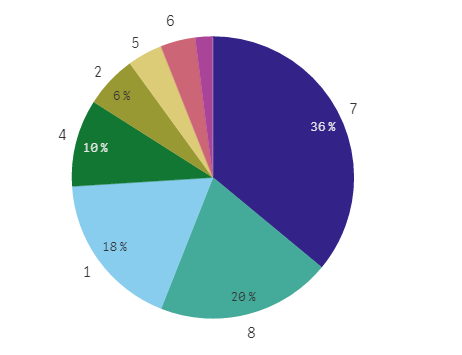
Here, 1 to 8 - titles
and I need to accentuate the region like:
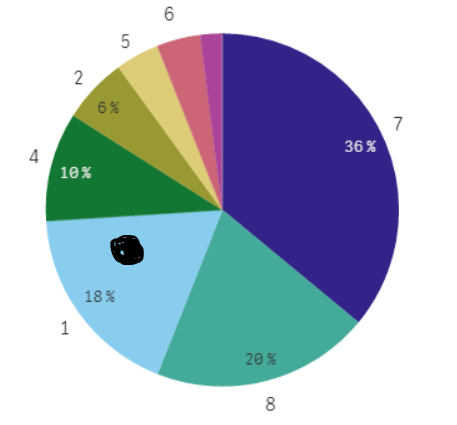
that is a dot stating that this company is located here.
Or as a highlighted region:
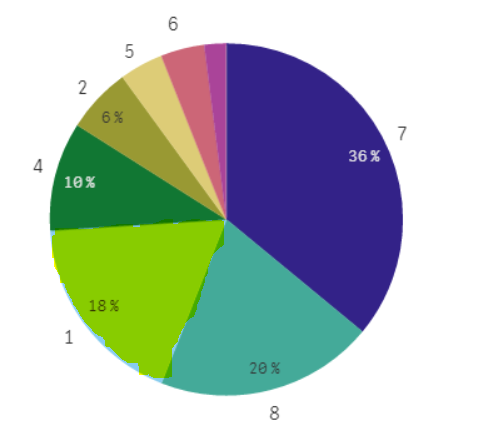
How to do that in Sense?
Accepted Solutions
- Mark as New
- Bookmark
- Subscribe
- Mute
- Subscribe to RSS Feed
- Permalink
- Report Inappropriate Content
The easiest way is to change the Color parameter to use "Color By Expression" option:
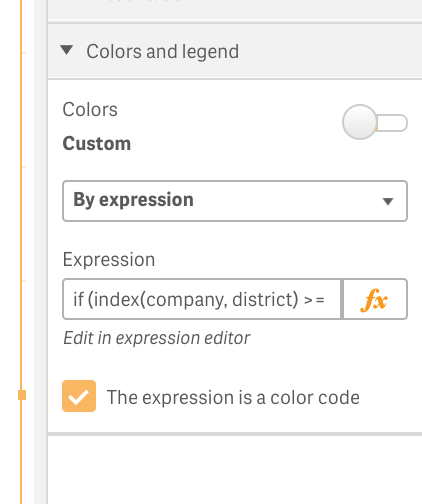
In my sample QVF (attached), I am checking the company name and forcing system to use a bright color (RGB(255, 0, 0)) for this segment. All other segments are painted with dark colors...
if (index(company, district) >= 1, rgb(255, 0, 0), rgb(Rand()*90, Rand()*90, Rand()*90))
The result:
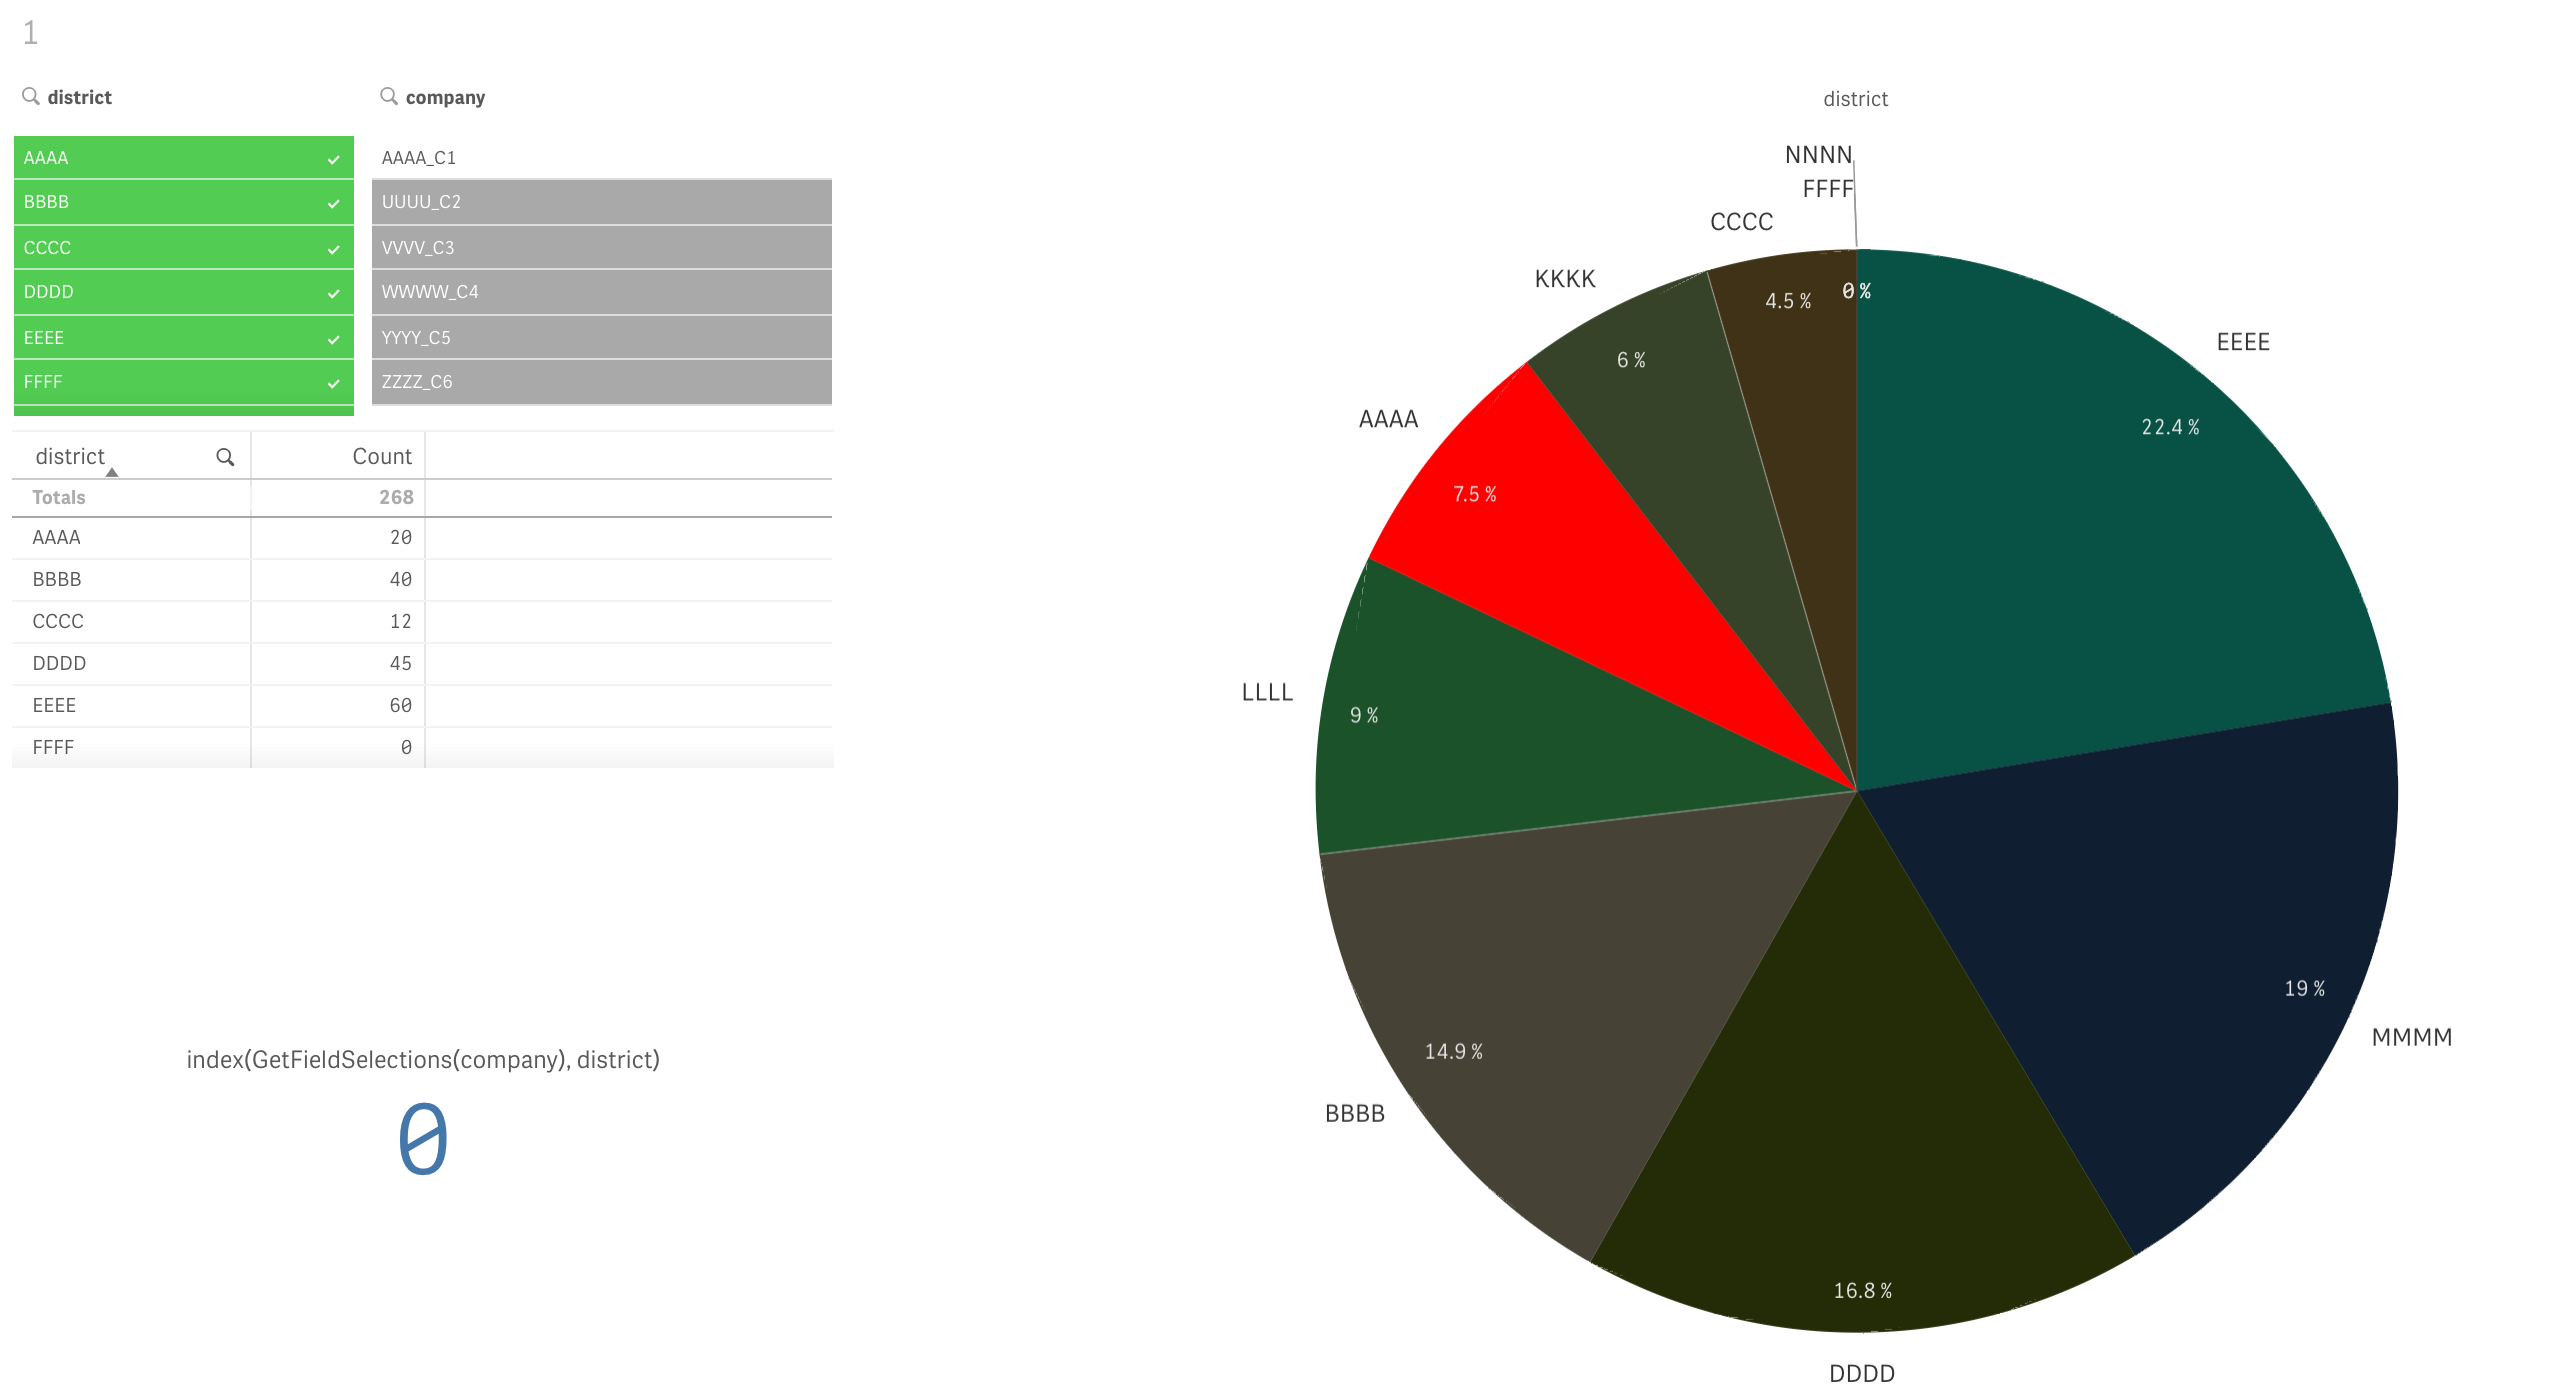
This is a simplified way and you might have more complex structure to map the company to the district.
I am not sure what requirements do you have, but I am sure you can update this algorithm to use any other conditions to select your colors.
Regards,
Vlad
- Mark as New
- Bookmark
- Subscribe
- Mute
- Subscribe to RSS Feed
- Permalink
- Report Inappropriate Content
Can you share your sample app to directly work on it?
- Mark as New
- Bookmark
- Subscribe
- Mute
- Subscribe to RSS Feed
- Permalink
- Report Inappropriate Content
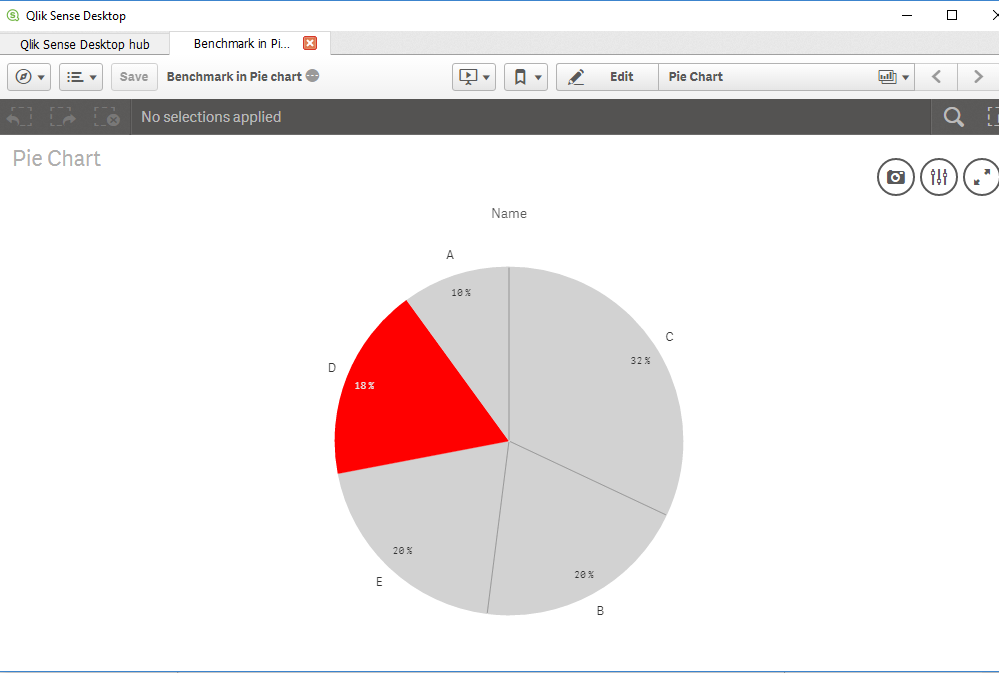
The easiest way is to change the Color parameter to use "Color By Expression" option:
In my sample QVF (attached), I am checking the company name and forcing system to use a bright color (RGB(255, 0, 0)) for this segment. All other segments are painted with dark colors...
if (index(company, district) >= 1, rgb(255, 0, 0), rgb(Rand()*90, Rand()*90, Rand()*90))
The result:
This is a simplified way and you might have more complex structure to map the company to the district.
I am not sure what requirements do you have, but I am sure you can update this algorithm to use any other conditions to select your colors.
Regards,
Vlad
- Mark as New
- Bookmark
- Subscribe
- Mute
- Subscribe to RSS Feed
- Permalink
- Report Inappropriate Content
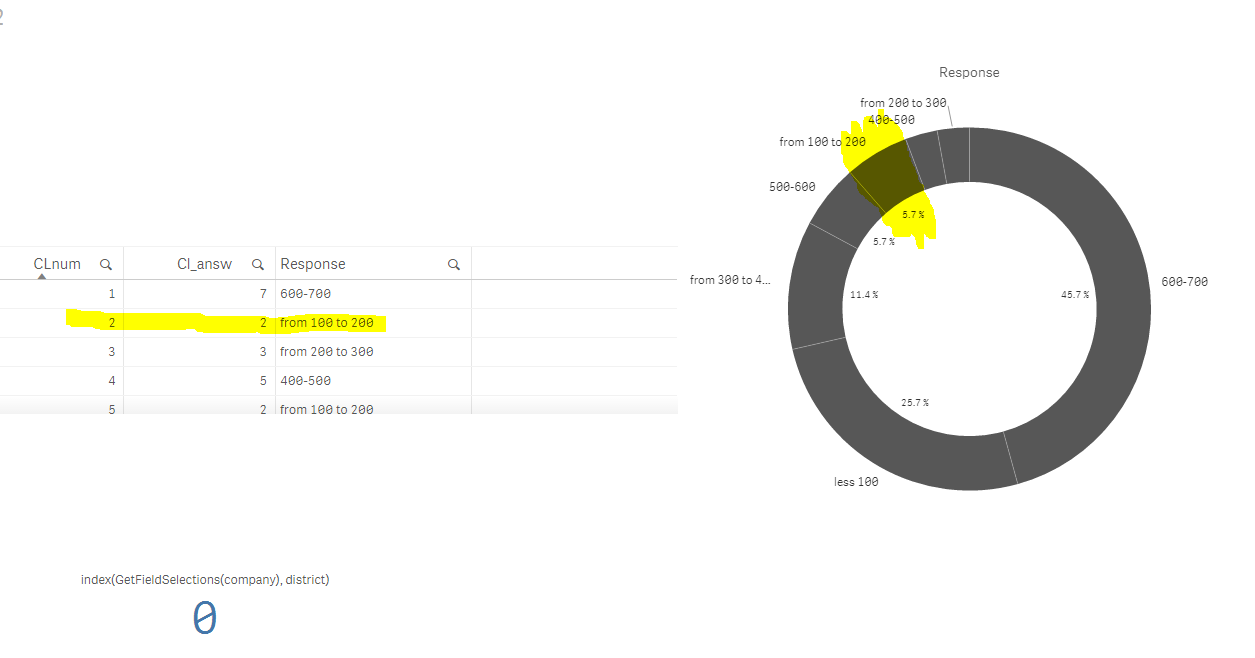
Here is my example (see attached file).
I need to paint the selected region as red on pie chart (see color by expression), can you help me to do that?
It works when I select Response filed (click with a mouse)
But i need it to work when I select CLnum row in table.
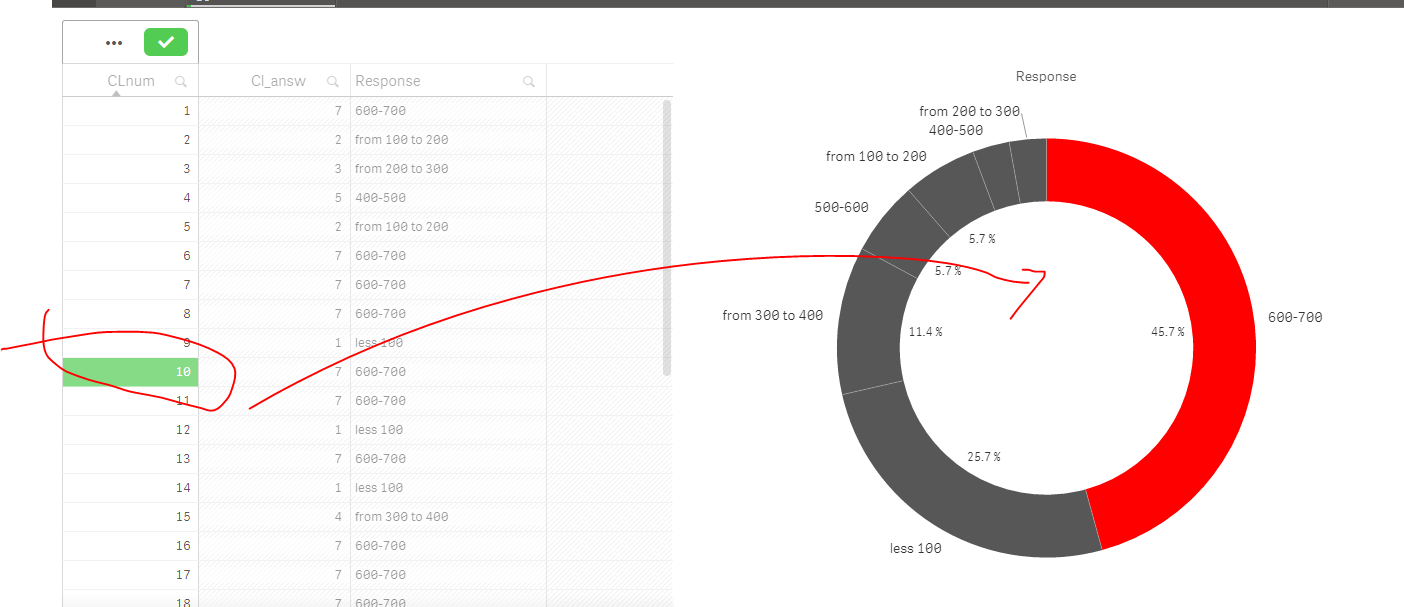
UPDATE: solved it.
see attach.
- Mark as New
- Bookmark
- Subscribe
- Mute
- Subscribe to RSS Feed
- Permalink
- Report Inappropriate Content
- Mark as New
- Bookmark
- Subscribe
- Mute
- Subscribe to RSS Feed
- Permalink
- Report Inappropriate Content
You just add it to you color expression:
if ( GetFieldSelections(Response) = Response or GetFieldSelections(CLnum) = CLnum , rgb(255, 0, 0), rgb(87, 87, 87))
- Mark as New
- Bookmark
- Subscribe
- Mute
- Subscribe to RSS Feed
- Permalink
- Report Inappropriate Content
oh, nice move, thanks ))