Unlock a world of possibilities! Login now and discover the exclusive benefits awaiting you.
- Qlik Community
- :
- Forums
- :
- Analytics
- :
- New to Qlik Analytics
- :
- Color Edit on Sense Funnel Chart and Table
- Subscribe to RSS Feed
- Mark Topic as New
- Mark Topic as Read
- Float this Topic for Current User
- Bookmark
- Subscribe
- Mute
- Printer Friendly Page
- Mark as New
- Bookmark
- Subscribe
- Mute
- Subscribe to RSS Feed
- Permalink
- Report Inappropriate Content
Color Edit on Sense Funnel Chart and Table
Good day sir,
I would love to edit my design.. I used the sense funnel extension to represent some HSE stats..
i want to extract field to show a particular color to a field..
for example : FAT should be expressed on red background
LTI orange for both the chart and table
I also when to change the text and the color of the fonts on the chart..
Please see attached for more infor
Regards
Akpofure
Accepted Solutions
- Mark as New
- Bookmark
- Subscribe
- Mute
- Subscribe to RSS Feed
- Permalink
- Report Inappropriate Content
- Mark as New
- Bookmark
- Subscribe
- Mute
- Subscribe to RSS Feed
- Permalink
- Report Inappropriate Content
You mean like this? In your table?
In the example below, Africa is colored Green

In your case you want FAT to be Red in your table?
- Mark as New
- Bookmark
- Subscribe
- Mute
- Subscribe to RSS Feed
- Permalink
- Report Inappropriate Content
Yes... I mean that and same for the funnel chart so one can look at the table (acting as a legend) to see its corresponding color on the funnel chart?
Regards
- Mark as New
- Bookmark
- Subscribe
- Mute
- Subscribe to RSS Feed
- Permalink
- Report Inappropriate Content
Maybe like this?
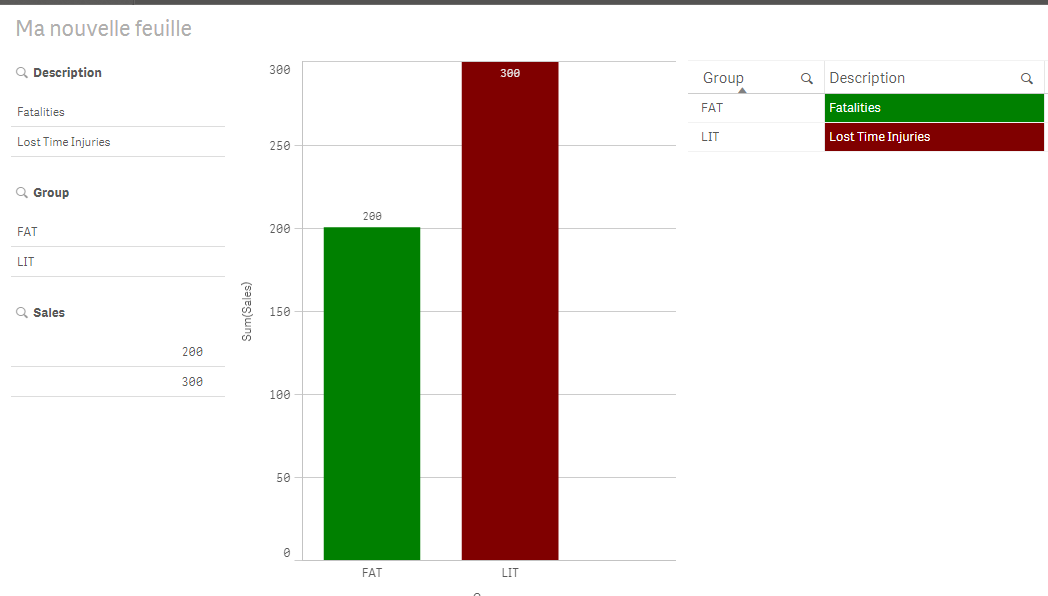
See the attached app
- Mark as New
- Bookmark
- Subscribe
- Mute
- Subscribe to RSS Feed
- Permalink
- Report Inappropriate Content
thank you omarbensalem