Unlock a world of possibilities! Login now and discover the exclusive benefits awaiting you.
- Qlik Community
- :
- Forums
- :
- Analytics
- :
- New to Qlik Analytics
- :
- Qlik Sense Chart - Restrict Results
Options
- Subscribe to RSS Feed
- Mark Topic as New
- Mark Topic as Read
- Float this Topic for Current User
- Bookmark
- Subscribe
- Mute
- Printer Friendly Page
Turn on suggestions
Auto-suggest helps you quickly narrow down your search results by suggesting possible matches as you type.
Showing results for
Not applicable
2017-04-07
07:49 AM
- Mark as New
- Bookmark
- Subscribe
- Mute
- Subscribe to RSS Feed
- Permalink
- Report Inappropriate Content
Qlik Sense Chart - Restrict Results
I have created a simple chart which shows Number of Sanctions by Country. Most Countries have one or two but I do not want to see these on Chart.
How do I either restrict countries with say less than 5 or group them all together as Others.
Can do this in Qlikview in the Chart set up but I can not work out how to do this in QlikSense.
Thank you
Ian
319 Views
1 Solution
Accepted Solutions
MVP
2017-04-07
11:50 AM
- Mark as New
- Bookmark
- Subscribe
- Mute
- Subscribe to RSS Feed
- Permalink
- Report Inappropriate Content
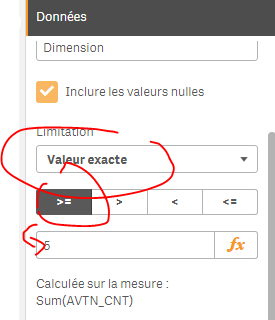
You can go to your dimension in the chart, and choose a limitation, exact value >=5 (based on your measure):
246 Views
2 Replies
MVP
2017-04-07
11:50 AM
- Mark as New
- Bookmark
- Subscribe
- Mute
- Subscribe to RSS Feed
- Permalink
- Report Inappropriate Content
You can go to your dimension in the chart, and choose a limitation, exact value >=5 (based on your measure):
247 Views
Not applicable
2017-04-10
10:15 AM
Author
- Mark as New
- Bookmark
- Subscribe
- Mute
- Subscribe to RSS Feed
- Permalink
- Report Inappropriate Content
Thank you for this, it worked perfectly.
Ian
246 Views
Community Browser