Unlock a world of possibilities! Login now and discover the exclusive benefits awaiting you.
- Qlik Community
- :
- Forums
- :
- Analytics
- :
- New to Qlik Analytics
- :
- Show two values in bar chart, in Qlik Sense
- Subscribe to RSS Feed
- Mark Topic as New
- Mark Topic as Read
- Float this Topic for Current User
- Bookmark
- Subscribe
- Mute
- Printer Friendly Page
- Mark as New
- Bookmark
- Subscribe
- Mute
- Subscribe to RSS Feed
- Permalink
- Report Inappropriate Content
Show two values in bar chart, in Qlik Sense
How can i show in bar chart two values (value & percentage), in Qlik Sense?
Thank you!
Accepted Solutions
- Mark as New
- Bookmark
- Subscribe
- Mute
- Subscribe to RSS Feed
- Permalink
- Report Inappropriate Content
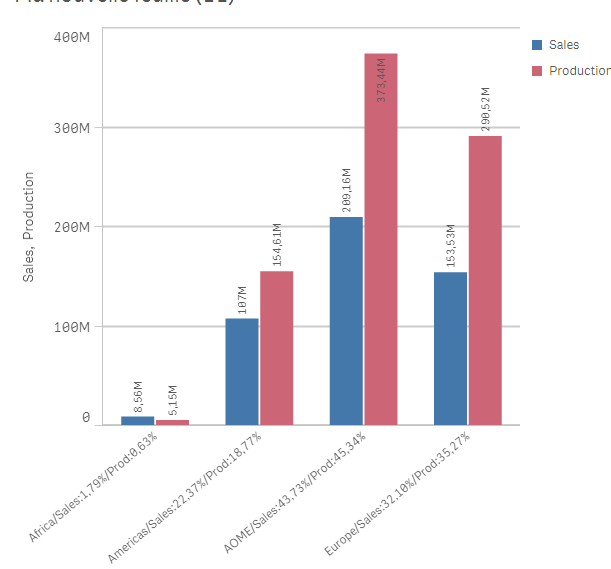
Well you can add it in the dimension, like we already did:
=[OICA region]&'/Sales:'&aggr(num((Sum({1}[Car sales])/Sum({1}total [Car sales])),'# ##0,00%'),[OICA region])
&'/Prod:'&aggr(num((Sum({1}[Car production])/Sum({1}total [Car production])),'# ##0,00%'),[OICA region])
result:
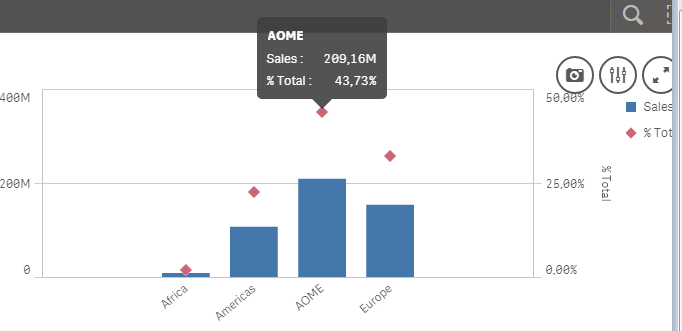
The other way to do, to have to have both the measure and its % in the same chart; is to use a combined chart:

Example:
dimension: "Oica Region"
Measure 1 : sum(Car Sales)
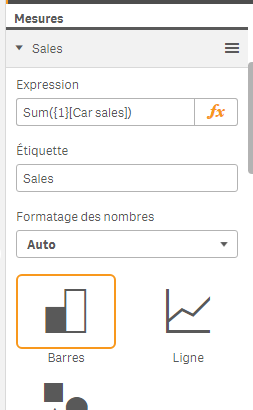
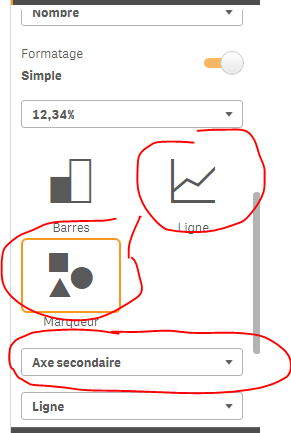
Measure 2:
Sum("Car Sales") / sum( total "Car Sales") , format it as % ,choose a representation other than Bars (sthing different from the first measure representation) and select "secondary axis"
result:
- Mark as New
- Bookmark
- Subscribe
- Mute
- Subscribe to RSS Feed
- Permalink
- Report Inappropriate Content
You can add the % besides the dimension values:
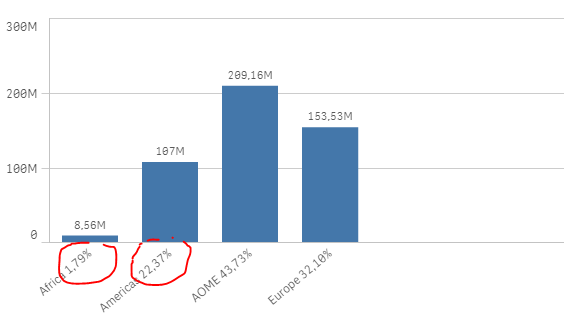
Example:
Dimension:
=[region]&' '&aggr(num((Sum([Car sales])/Sum({1}total [Car sales])),'# ##0,00%'),[region])
Measure:
sum("Car sales")
- Mark as New
- Bookmark
- Subscribe
- Mute
- Subscribe to RSS Feed
- Permalink
- Report Inappropriate Content
Hi Omar,
Thank you for your answer!
I have one dimension and more many measure on the same chart. How can I see for each other value & percentage?
Thank you!
Magdalena
- Mark as New
- Bookmark
- Subscribe
- Mute
- Subscribe to RSS Feed
- Permalink
- Report Inappropriate Content
Well you can add it in the dimension, like we already did:
=[OICA region]&'/Sales:'&aggr(num((Sum({1}[Car sales])/Sum({1}total [Car sales])),'# ##0,00%'),[OICA region])
&'/Prod:'&aggr(num((Sum({1}[Car production])/Sum({1}total [Car production])),'# ##0,00%'),[OICA region])
result:
The other way to do, to have to have both the measure and its % in the same chart; is to use a combined chart:
Example:
dimension: "Oica Region"
Measure 1 : sum(Car Sales)
Measure 2:
Sum("Car Sales") / sum( total "Car Sales") , format it as % ,choose a representation other than Bars (sthing different from the first measure representation) and select "secondary axis"
result:
- Mark as New
- Bookmark
- Subscribe
- Mute
- Subscribe to RSS Feed
- Permalink
- Report Inappropriate Content
Hi Omar,
Thank you!!
Magdalena
- Mark as New
- Bookmark
- Subscribe
- Mute
- Subscribe to RSS Feed
- Permalink
- Report Inappropriate Content
here I would like to extend the question asked earlier.
My question is how to display relative percentage ?(i.e., display percentage only with the current selections, not by taking all the whole dimension values)
For example,in the above chart if I selected only Africa, Americans, Europe the percentage for Europe should be displayed only by considering the selection items but not all items that are loaded in that dimension.
Thanks in advance !!
- Mark as New
- Bookmark
- Subscribe
- Mute
- Subscribe to RSS Feed
- Permalink
- Report Inappropriate Content
If your measure is for example : sum(Sales) and your dimension is Region:
just do as follow:
sum(Sales) / sum( Total {<Region>} Sales)