Unlock a world of possibilities! Login now and discover the exclusive benefits awaiting you.
- Qlik Community
- :
- All Forums
- :
- QlikView App Dev
- :
- Data model
- Subscribe to RSS Feed
- Mark Topic as New
- Mark Topic as Read
- Float this Topic for Current User
- Bookmark
- Subscribe
- Mute
- Printer Friendly Page
- Mark as New
- Bookmark
- Subscribe
- Mute
- Subscribe to RSS Feed
- Permalink
- Report Inappropriate Content
Data model
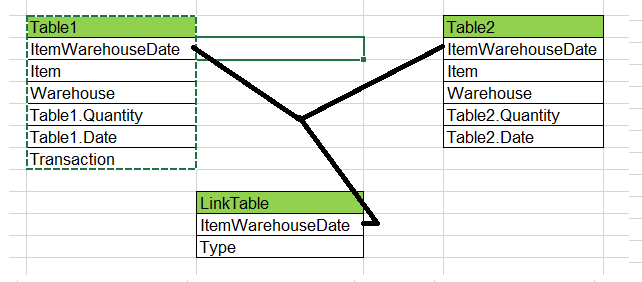
In my data model I have two facts table, every table has own date field. I need to create chart that should show data from each table on one time axes. Originally those tables was linked by Item - Warehouse key, but when I created link table I found that in this case I will have incorrect data because one Item-Warehouse combination can have more than one row with data, so I created key based on three field Warehouse, Item and Date
Item Warehouse Quantity Item Warehouse Date Quantity
1111 US1 10 1111 US1 20170401 2
1111 US1 20170402 5
1111 US1 20170311 3
Link table also contains type(table1 or table2 ) and calendar.
My problem: when I use such key I can build necessary chart , but this key cut part of data from second table.
For example:
Dimension is Transaction and I want to show sum of Table2.Quantity. If I use ItemWarehouse I see all data, but if I use itemWarehouse Date I see only piece of data
Simple example
If it's possible please mark correct answers as "solutions" (you can mark up to 3 "solutions").
- Tags:
- qlikview_scripting