Unlock a world of possibilities! Login now and discover the exclusive benefits awaiting you.
Announcements
Live today at 11 AM ET. Get your questions about Qlik Connect answered, or just listen in.
SIGN UP NOW
- Qlik Community
- :
- Forums
- :
- Analytics
- :
- New to Qlik Analytics
- :
- QlikSense Sankey Diagram Help
Options
- Subscribe to RSS Feed
- Mark Topic as New
- Mark Topic as Read
- Float this Topic for Current User
- Bookmark
- Subscribe
- Mute
- Printer Friendly Page
Turn on suggestions
Auto-suggest helps you quickly narrow down your search results by suggesting possible matches as you type.
Showing results for
Contributor II
2017-04-24
05:16 PM
- Mark as New
- Bookmark
- Subscribe
- Mute
- Subscribe to RSS Feed
- Permalink
- Report Inappropriate Content
QlikSense Sankey Diagram Help
Hello ,
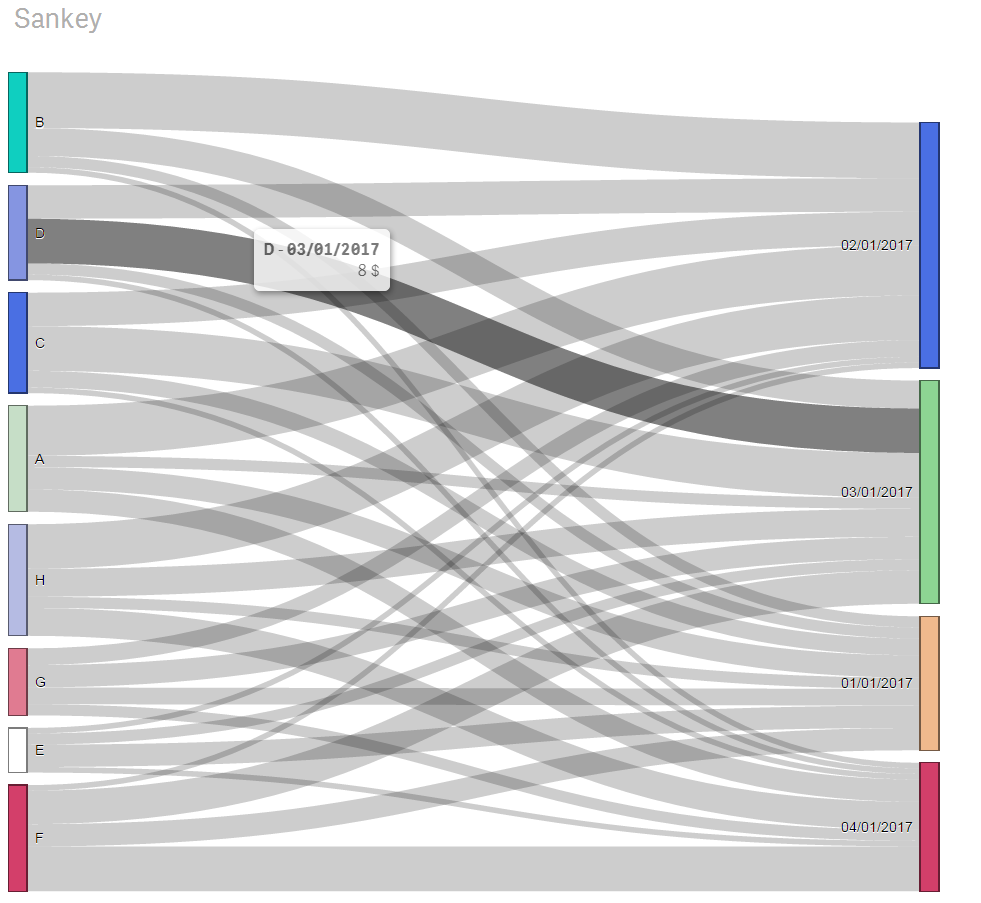
I have three fields: Pattern / Month / Value
I would like to display thru Sankey Diagram a month over month movement in the Pattern. Therefore, the Sankey would have Two Dimensions: Pattern_-1 month and Pattern_Current Month
- I can show Dimensions Pattern and Date as you see below, but I would prefer to only display Pattern prior month and Pattern current month.
- I tried a set analysis for current month but did not work: Aggr(Only({<Date={'04/01/2017'}>} Pattern ), Pattern)
Any guidance will be appreciated.
1,199 Views
0 Replies
Community Browser