Unlock a world of possibilities! Login now and discover the exclusive benefits awaiting you.
- Qlik Community
- :
- Forums
- :
- Analytics
- :
- App Development
- :
- Qlik Sense - Colouring of Stacked bar charts and C...
- Subscribe to RSS Feed
- Mark Topic as New
- Mark Topic as Read
- Float this Topic for Current User
- Bookmark
- Subscribe
- Mute
- Printer Friendly Page
- Mark as New
- Bookmark
- Subscribe
- Mute
- Subscribe to RSS Feed
- Permalink
- Report Inappropriate Content
Qlik Sense - Colouring of Stacked bar charts and Combo charts
Hi everyone,
I would like to ask if there are any solutions for defining colors in Qlik Sense combo or stacked bar charts?
Currently, the only way that i know of is using the color expression. This is possible if i were to hardcode it.
A sample script of the expression would be:
if (Count(Name)>= 100, (rgb(8, 9, 10)),
if (Count(Name)>= 90,(rgb(124, 123, 119)),
if (Count(Name)>= 56,(rgb(188, 186, 177)),
if (Count(Name)>= 44,(rgb(224, 178, 11)),
if (Count(Name)>= 30,(rgb(14, 96, 140)),
if (Count(Name)>= 15,(rgb(181, 222, 244)), (rgb(249, 249, 247))))))))
However, if i want to color my bars according this expression:
count({$<[FAKEYN]={"Y"}>} FAKEYN)
count(APPROVED)
count({$<[TYPE1]={"2"}>} TYPE1)
where each expression represents a different variable, i am unable to do so.
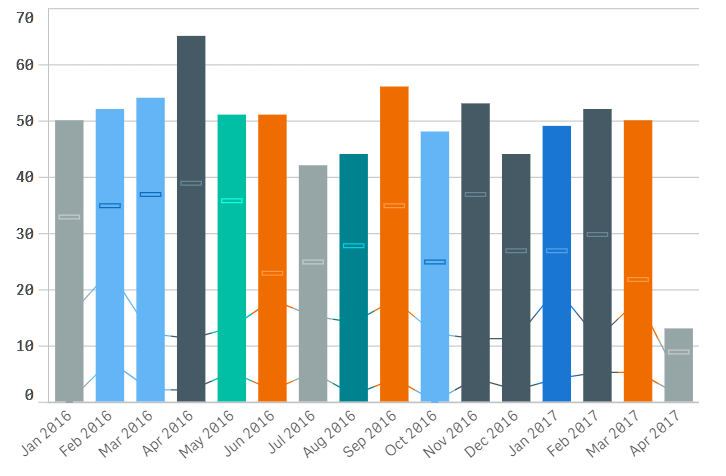
The closest i have gotten to solve this is to use the ColourStyler extension downloaded. What i have done is i have linked the visualization, changed the colors using the extension, unlinked the visualization and edit the color expression code. BUT, i am only able to colour the entire stacked bar (Same color) instead of them individually. I am also unable to colour the bars specifically. (See before and after)
Before
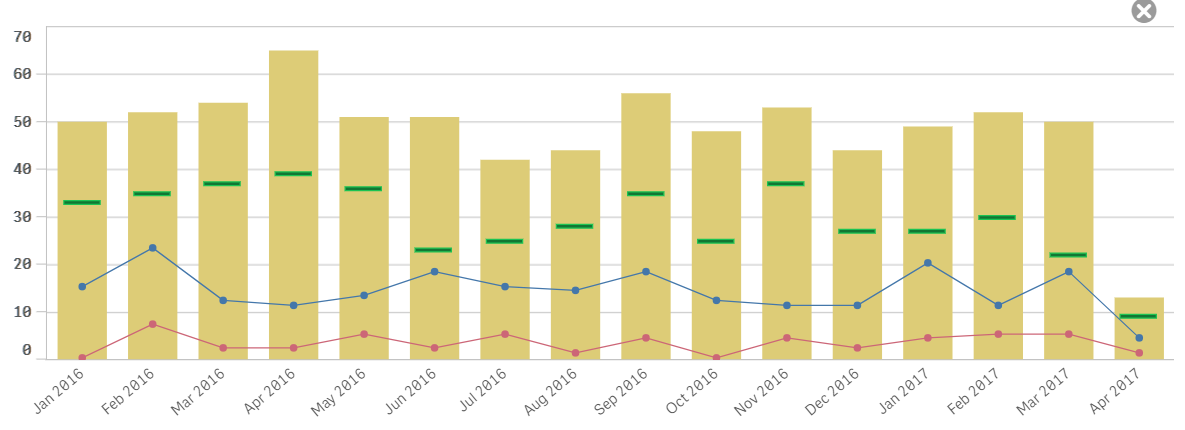
After
Does anyone know how to go about this? Be it an expression that i am unaware of or whether it is a limited capability of QlikSense for now.
Thanks and regards,
Gaston
- Tags:
- bar
- chart
- color
- colour
- colour expression
- colur expression
- combo
- expression
- help
- limited
- qlik
- qlik sense
- sense
- stacked
- unable
- Mark as New
- Bookmark
- Subscribe
- Mute
- Subscribe to RSS Feed
- Permalink
- Report Inappropriate Content
Gaston,
A half year later... are you still working on this?
First of all, what does the "after" picture represent?
Also, I'm not sure I understand your requirements. Do you want each bar to be colored by its own, distinct expression?