Unlock a world of possibilities! Login now and discover the exclusive benefits awaiting you.
- Qlik Community
- :
- Forums
- :
- Analytics
- :
- New to Qlik Analytics
- :
- Are line charts and combo charts in 3.2 SR3 faulty...
- Subscribe to RSS Feed
- Mark Topic as New
- Mark Topic as Read
- Float this Topic for Current User
- Bookmark
- Subscribe
- Mute
- Printer Friendly Page
- Mark as New
- Bookmark
- Subscribe
- Mute
- Subscribe to RSS Feed
- Permalink
- Report Inappropriate Content
Are line charts and combo charts in 3.2 SR3 faulty?
Hi all,
I cannot get the linecharts to display any insights at all.
First of all I have read the help which states "When the number of dimension values exceeds the width of the visualization, a mini chart with a scroll bar is displayed." (https://help.qlik.com/en-US/sense/3.2/Subsystems/Hub/Content/Visualizations/LineChart/line-chart.htm)
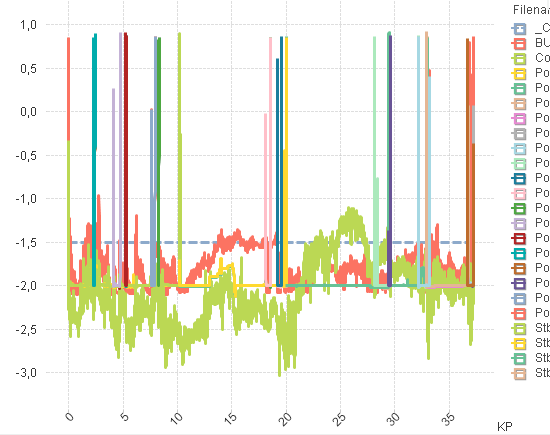
I have a chart in Qlikview which I want to recreate in Sense. It displays a process which is working over 37 km taking a sample at least each meter. The data is stored in files and the files are often overlapping. Every meter counts. I want to display the data in a line chart with one line per file of data. In Qlikview it looks like this and the customer is happy. Now they are thinking of selecting a new BI-tool and Sense is on the short list but they want some important Qlikview-apps to be recreated to see the pros and cons.
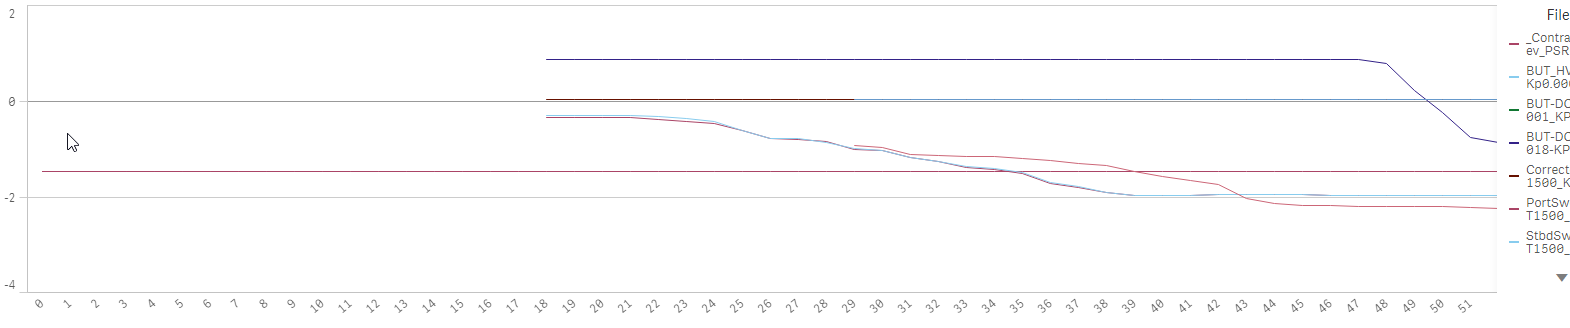
In Qlik Sense it looks like this, only the first 51 meters are displayed, and there is definitely no "mini chart with a scroll bar"
Anyone know how to force a line-chart to somehow give a hint on the data I want to display?
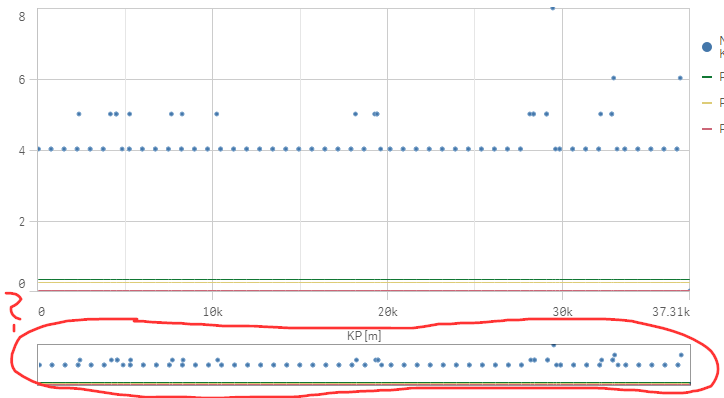
On the other hand when using a combo chart there is a mini-chart which is just super stupid, it does not add anything more than clutter to the layout, no possibilities to scroll nor to make any selections...
I guess I must be me overlooking some way to tweak the objects since it cannot be this bad, anyone else who have spent time on this and can explain?
- Mark as New
- Bookmark
- Subscribe
- Mute
- Subscribe to RSS Feed
- Permalink
- Report Inappropriate Content
Found out that the mini-chart comes alive when scrolling in the main-chart with the mouse-wheel.