Unlock a world of possibilities! Login now and discover the exclusive benefits awaiting you.
- Qlik Community
- :
- Forums
- :
- Analytics
- :
- New to Qlik Analytics
- :
- How can I create a drill-drop dimension for a grou...
- Subscribe to RSS Feed
- Mark Topic as New
- Mark Topic as Read
- Float this Topic for Current User
- Bookmark
- Subscribe
- Mute
- Printer Friendly Page
- Mark as New
- Bookmark
- Subscribe
- Mute
- Subscribe to RSS Feed
- Permalink
- Report Inappropriate Content
How can I create a drill-drop dimension for a group of states?
Hello all,
I am working on a presentation for Medicaid spending and I'm using raw data comprised of totals from all 50 states. In my visualization, I would like to add a drill-drop dimension to a bar chart, so that I start out with four to five groups of states (such as East Coast, West Coast, Midwest, etc.) and have the ability to drill down into them so I could see the states that make up each group along with their respective totals. I was able to place all 50 states in a bar chart and I have been stuck ever since. I would like them to be in alphabetical order. I'm attaching a screenshot of what I have so far if it helps, thanks again in advance! I truly appreciate it.
Sincerely,
Munna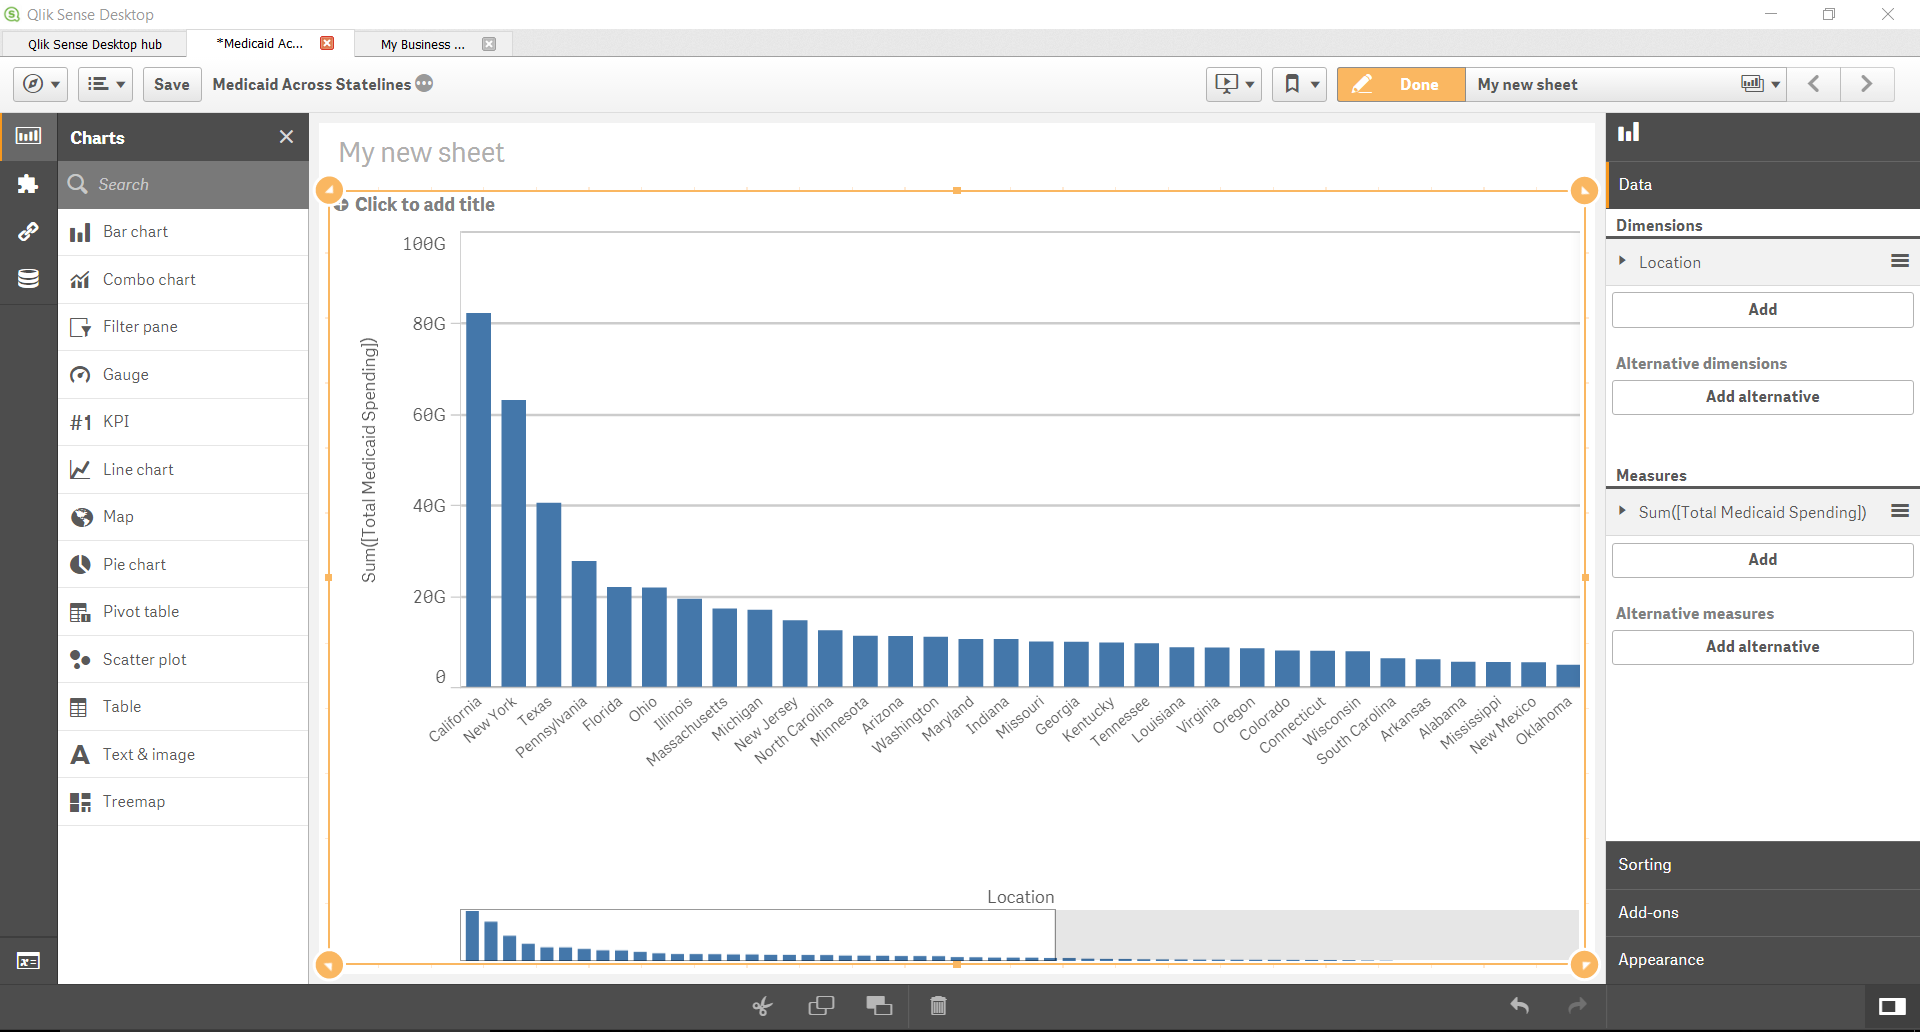
- Tags:
- drilldrop
- qlik sense
- Mark as New
- Bookmark
- Subscribe
- Mute
- Subscribe to RSS Feed
- Permalink
- Report Inappropriate Content
If you have a dimension containing the east, north, south etc information; let's called region for example;
you can create a drill down dimension as a master dimension.
first dimension: region, second one: location.
see the video below: