Unlock a world of possibilities! Login now and discover the exclusive benefits awaiting you.
- Qlik Community
- :
- All Forums
- :
- QlikView App Dev
- :
- Pivot Table Totals
- Subscribe to RSS Feed
- Mark Topic as New
- Mark Topic as Read
- Float this Topic for Current User
- Bookmark
- Subscribe
- Mute
- Printer Friendly Page
- Mark as New
- Bookmark
- Subscribe
- Mute
- Subscribe to RSS Feed
- Permalink
- Report Inappropriate Content
Pivot Table Totals
I have read a lot of threads about the pivot table totals but can't seem to find a similar post to what I require (and am also still learning).
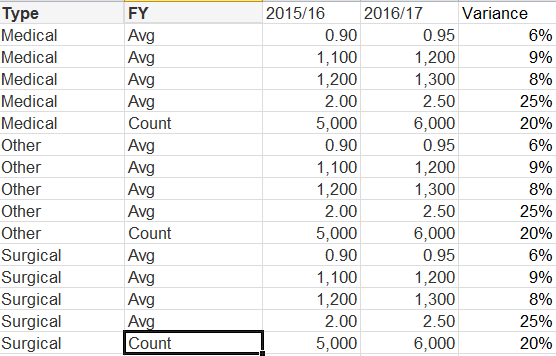
I have a pivot table with two dimensions, Type and FY, where I have type on the left and FY across the top (pictured below).
There are five expressions within the table (the avg and count rows). I just want to calculate the difference of these rows to come up with the % variance as demonstrated below.
Appreciate any feedback or suggestions to construct this better to give me a result similar to the above. With Thanks B.
- Mark as New
- Bookmark
- Subscribe
- Mute
- Subscribe to RSS Feed
- Permalink
- Report Inappropriate Content
Hi,
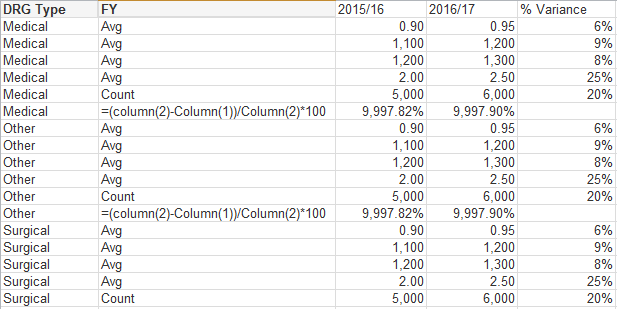
in Variance expression:
=(column(2)-Column(1))/column(2)*100
**column(1)=2015/16
**column(2)=2016/17
- Mark as New
- Bookmark
- Subscribe
- Mute
- Subscribe to RSS Feed
- Permalink
- Report Inappropriate Content
Hi
When I try this I get the following result:
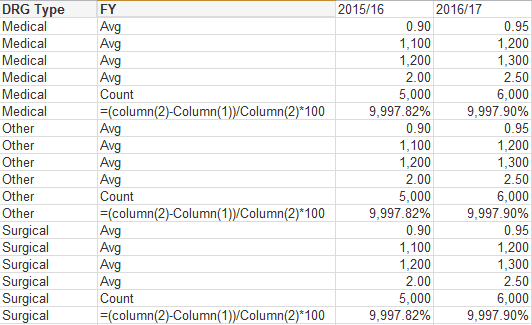
I ideally want the % to sit beside the 2016/17 Column...
Appreciate any thoughts... thanks
- Mark as New
- Bookmark
- Subscribe
- Mute
- Subscribe to RSS Feed
- Permalink
- Report Inappropriate Content
There is a workaround to create new column like this.
Step1 - Add one inline island table in the data table as -
Dim:
LOAD * Inline [
Dim
1
2
];
Step2 -
In the chart use your FY dimension as -
=Pick(Dim,[Sold Year],'Variance') //So Dim =1 will act as usual FY values and Dim=2 for your new variance column.
Use your expressions like below, just an example-
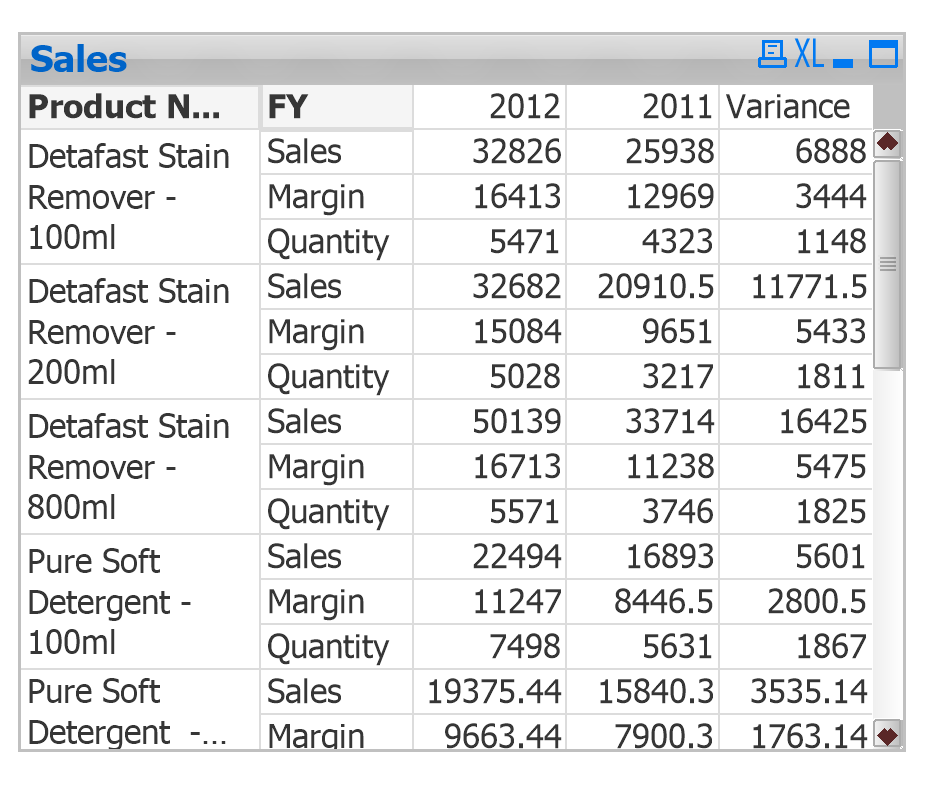
Pick(Dim,Sum([# Sales Amount]),Sum({<[Sold Year]={2012}>}[# Sales Amount])-Sum({<[Sold Year]={2011}>}[# Sales Amount]))
Sample chart using above method -
- Mark as New
- Bookmark
- Subscribe
- Mute
- Subscribe to RSS Feed
- Permalink
- Report Inappropriate Content
Can share any sample app