Unlock a world of possibilities! Login now and discover the exclusive benefits awaiting you.
- Qlik Community
- :
- All Forums
- :
- Qlik NPrinting
- :
- NPrinting chart render help
- Subscribe to RSS Feed
- Mark Topic as New
- Mark Topic as Read
- Float this Topic for Current User
- Bookmark
- Subscribe
- Mute
- Printer Friendly Page
- Mark as New
- Bookmark
- Subscribe
- Mute
- Subscribe to RSS Feed
- Permalink
- Report Inappropriate Content
NPrinting chart render help
Background
I have created an NPrinting connection, app and report choosing excel as the output. I have added the Qliksense objects into the NPrinting report.
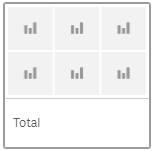
I need the show 6 charts per page to render in the format as below:
Three wide by two deep on a landscape page.
In the Qliksense app (that feeds the NPrinting app) we can see that the chart rendering enforces the slide bar at the bottom rather than allowing the user to choose to display all of the chart (See below).
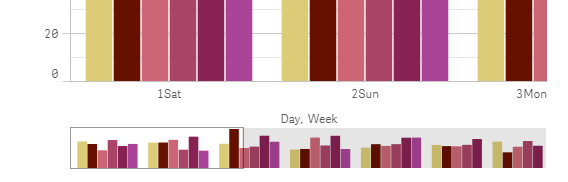
When I migrate this to the NPrinting app it renders ‘as is’ so it is totally useless as the end user cannot scroll.
I then rebuilt the same chart full size on the Qliksense app page so as to display the whole chart (remove slide bar).
I then add the charts objects to the NPrinting excel app in a row with three charts fitting to one page width
<Object 1> <Object 2> <Object 2>
The result is that each chart covers the whole excel page width (One chart per page) and ignores my selected positions
How do I get the charts to show how I want them to?
Can I put pivot tables in the excel NPrinting file to create my own charts?
- Mark as New
- Bookmark
- Subscribe
- Mute
- Subscribe to RSS Feed
- Permalink
- Report Inappropriate Content
Hi Darrell,
When you add QlikView or Qlik Sense objects into the Qlik NPrinting Images node they are exported as they are in the original QlikView document or Qlik Sense app. Slide bars in images are not interactive.
When you drag and drop an image tag in an Excel template it will be added as a tag without previewing the final image dimensions as it happens in Word and PowerPoint templates, but in all cases you can set image dimensions as shoewd in the help page http://help.qlik.com/en-US/nprinting/17.3/Content/ReportsDevelopment/ImageDimensionManagementMicroso...
Qlik NPrinting supports Excel pivot tables and pivot charts. Refer to the help pages Creating pivot table using Excel table columns ‒ Qlik NPrinting and Creating an Excel pivot table report using levels ‒ Qlik NPrinting.
Pivot tables and charts in the final Excel reports are normal Excel pivot tables and charts. They contains the data at the moment of the report creation and they are interactive.
Best,
Ruggero
Best Regards,
Ruggero
---------------------------------------------
When applicable please mark the appropriate replies as CORRECT. This will help community members and Qlik Employees know which discussions have already been addressed and have a possible known solution. Please mark threads with a LIKE if the provided solution is helpful to the problem, but does not necessarily solve the indicated problem. You can mark multiple threads with LIKEs if you feel additional info is useful to others.