Unlock a world of possibilities! Login now and discover the exclusive benefits awaiting you.
- Qlik Community
- :
- Forums
- :
- Analytics
- :
- App Development
- :
- Full Accumulation in QlikSense
- Subscribe to RSS Feed
- Mark Topic as New
- Mark Topic as Read
- Float this Topic for Current User
- Bookmark
- Subscribe
- Mute
- Printer Friendly Page
- Mark as New
- Bookmark
- Subscribe
- Mute
- Subscribe to RSS Feed
- Permalink
- Report Inappropriate Content
Full Accumulation in QlikSense
Goal is to sum subscription dollars over time to see how individual companies are growing within our ecosystem over time.
I am using QlikSense. I know there is not a Full Accumulation button in QlikSense so I have been using the following expression.
= rangesum(above(Sum({<[Opps.IsWon] = {'1'}>}[Opps.ARR_equivalent__c]),0,rowno()))
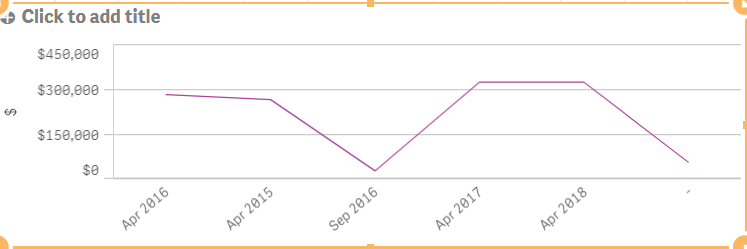
However it is not working as expected. If you see the graph below it is just summing the subscription amounts per subscription start date (x axis) ... Any help is appreciated!!!
- Tags:
- accumulated total
Accepted Solutions
- Mark as New
- Bookmark
- Subscribe
- Mute
- Subscribe to RSS Feed
- Permalink
- Report Inappropriate Content
Do you have two dimensions in your chart? May be this
=RangeSum(Above(TOTAL Sum({<[Opps.IsWon] = {'1'}>}[Opps.ARR_equivalent__c]), 0, RowNo(TOTAL)))
- Mark as New
- Bookmark
- Subscribe
- Mute
- Subscribe to RSS Feed
- Permalink
- Report Inappropriate Content
Do you have two dimensions in your chart? May be this
=RangeSum(Above(TOTAL Sum({<[Opps.IsWon] = {'1'}>}[Opps.ARR_equivalent__c]), 0, RowNo(TOTAL)))
- Mark as New
- Bookmark
- Subscribe
- Mute
- Subscribe to RSS Feed
- Permalink
- Report Inappropriate Content
Yes I do, 1 dimension is SUBSCRIPTION START DATE on X axis, 2nd dimension is ACCOUNT NAME ...
This worked. Thank you!