Unlock a world of possibilities! Login now and discover the exclusive benefits awaiting you.
- Qlik Community
- :
- All Forums
- :
- QlikView App Dev
- :
- Count occurrences of selected day records across t...
- Subscribe to RSS Feed
- Mark Topic as New
- Mark Topic as Read
- Float this Topic for Current User
- Bookmark
- Subscribe
- Mute
- Printer Friendly Page
- Mark as New
- Bookmark
- Subscribe
- Mute
- Subscribe to RSS Feed
- Permalink
- Report Inappropriate Content
Count occurrences of selected day records across the prior xxx #days
I am tasked with creating a QV app that I’m not sure how to approach and hoping someone can give me some guidance.
It initially sounded simple, but after some time spinning my wheels I found that it is not (at least for me). The app needs to look at distinct telephone numbers for the previous day (only), then look back x number of days (x=variable set by date selected) to see if they called on each day throughout the date range (Range = Date selected thru Previous day). If they haven’t called on any of the previous days, then it’s a Yes for that telephone number. If they have called, it’s a No. # of Yes / # of No = First Call Resolution %.
I started out using this methodology/approach:
NoConcatenate
PrevDay:
Load Distinct
datekey,
cName,
TelephoneNum,
TelephoneNum as pdTelephoneNum,
1 as pdCT
Resident Calls
Where datekey = Date(Today(1)-1);
NoConcatenate
PrevMth:
Load Distinct
TelephoneNum,
TelephoneNum as pmTelephoneNum,
If(datekey <= Today(1)-2 and datekey >= Today(1)-8,1) as Prev7CT
Resident Calls
Where Exists (pdTelephoneNum,TelephoneNum)
and datekey <= Today(1)-2 and datekey >= Today(1)-8;
Expression:
(RangeSum(Above(Sum({<datekey>}Prev7CT), 0, 6)) * Avg(1)) / (RangeSum(Above(Sum({<datekey>}pdCT), 0, 1))* Avg(1))
It appears to work fine, but is limited to the date ranges. I might ultimately have to do this in seven-day blocks to view trending.
Is there a way to use an expression to do this using the raw data (not grouped in the load script)? Something like Count(datekey={">=$( vSelectedStop) <=$( vSelectedStart)"} TelephoneNum) / Count(datekey={‘$(vSelectedStart)’}>}TelephoneNum. I can’t get it to work, which I’m thinking is due to (non) aggregation. I’m spinning my wheels…
Many thanks in advance.
Accepted Solutions
- Mark as New
- Bookmark
- Subscribe
- Mute
- Subscribe to RSS Feed
- Permalink
- Report Inappropriate Content
Since a requirement is to be able to select a date and show the days backwards from it, the datediff didn't align. The asoftable seems better suited for accumulating charts. I really want to make sure I understand them. Did I implement it correctly in the sample file?
I was able to create an app for initial review using set analysis. Couldn't use it at first because date was used as a dimension. I created an island date table so that the user can select a date, click a button, and set a variable. The variable is used in set analysis for each column in decrements of -1. sum({<datekey={"$(=Date(vdatekey - 1))"}>}Ct), sum({<datekey={"$(=Date(vdatekey - 2))"}>}Ct), sum({<datekey={"$(=Date(vdatekey - 3))"}>}Ct), etc... So now, one can select the date they wish to view, select the Trailing # of days, and counts will be shown. This is just a first pass as I think the requester will want/need more.
Again, I'm curious to know more about the asoftable implementation.
- Mark as New
- Bookmark
- Subscribe
- Mute
- Subscribe to RSS Feed
- Permalink
- Report Inappropriate Content
Updated post with a sample app.
 !
!
- Mark as New
- Bookmark
- Subscribe
- Mute
- Subscribe to RSS Feed
- Permalink
- Report Inappropriate Content
If date is going to be one of your dimension, then you will need to use Above() or Below() function to do this rather than using set analysis here... but it does make sense to do it in script using The As-Of Table
- Mark as New
- Bookmark
- Subscribe
- Mute
- Subscribe to RSS Feed
- Permalink
- Report Inappropriate Content
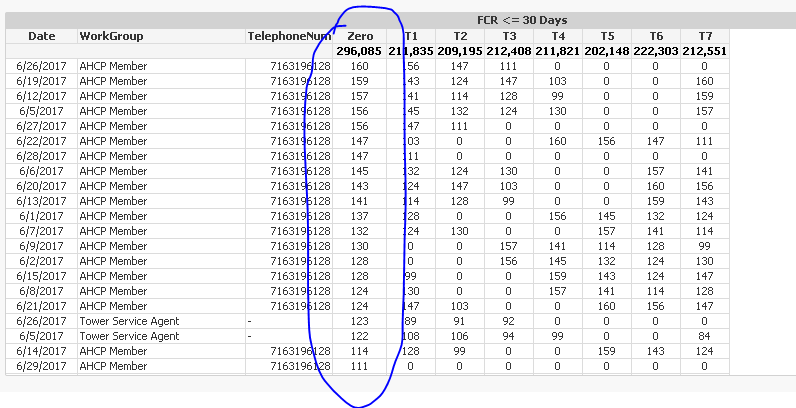
As always, thank you, Sunny. I tried to use the AsOfTable, but don't think I'm doing it correctly. I'm concerned with the DateDiff.
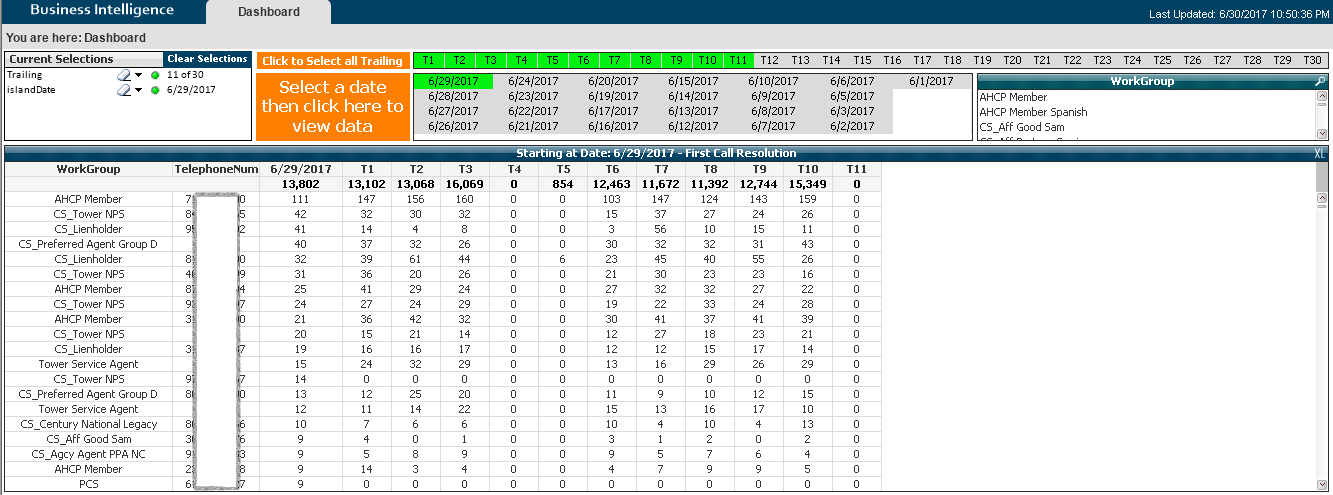
I need the app to show the call total in the Zero column, for the date selected. Then, T1 is 'Trailing 1' day. T2 is 'Trailing 2' days, etc.
I feel like it's as simple as a below expression for each T, but I can't figure it out. Am I thinking about it the right way?
An updated app is attached.
- Mark as New
- Bookmark
- Subscribe
- Mute
- Subscribe to RSS Feed
- Permalink
- Report Inappropriate Content
Not sure what you concerns are... if it is just the 0 day... you did not use the set analysis for Zero column. May be try this
Sum({<datekeyDiff={0}>} Ct)
Not sure if that was the only issue, or if there are more issues?
- Mark as New
- Bookmark
- Subscribe
- Mute
- Subscribe to RSS Feed
- Permalink
- Report Inappropriate Content
Since a requirement is to be able to select a date and show the days backwards from it, the datediff didn't align. The asoftable seems better suited for accumulating charts. I really want to make sure I understand them. Did I implement it correctly in the sample file?
I was able to create an app for initial review using set analysis. Couldn't use it at first because date was used as a dimension. I created an island date table so that the user can select a date, click a button, and set a variable. The variable is used in set analysis for each column in decrements of -1. sum({<datekey={"$(=Date(vdatekey - 1))"}>}Ct), sum({<datekey={"$(=Date(vdatekey - 2))"}>}Ct), sum({<datekey={"$(=Date(vdatekey - 3))"}>}Ct), etc... So now, one can select the date they wish to view, select the Trailing # of days, and counts will be shown. This is just a first pass as I think the requester will want/need more.
Again, I'm curious to know more about the asoftable implementation.
- Mark as New
- Bookmark
- Subscribe
- Mute
- Subscribe to RSS Feed
- Permalink
- Report Inappropriate Content
I don't think that asoftable is only good for accumulating, I think it makes year over year comparison easier as well...
With regards to the issue you are still having, I am not sure I completely understand your concern with DateDiff? I know you have explained it above, but I am still having difficulty understanding. Do you mind making another attempt in explaining the issue?
- Mark as New
- Bookmark
- Subscribe
- Mute
- Subscribe to RSS Feed
- Permalink
- Report Inappropriate Content
Sunny, thank you for the follow-up.
Whereas I needed a sum from the number of days the user selected, I just wan't sure how the datediff field in an asoftable could be used. Guess I would need to see an app where an asoftable has been implemented to understand how it works/what it does. Do you know of any in the QV downloadable samples?