Unlock a world of possibilities! Login now and discover the exclusive benefits awaiting you.
- Qlik Community
- :
- Forums
- :
- Analytics
- :
- App Development
- :
- Qliksense Align Values in centre
Options
- Subscribe to RSS Feed
- Mark Topic as New
- Mark Topic as Read
- Float this Topic for Current User
- Bookmark
- Subscribe
- Mute
- Printer Friendly Page
Turn on suggestions
Auto-suggest helps you quickly narrow down your search results by suggesting possible matches as you type.
Showing results for
Not applicable
2017-06-30
01:51 AM
- Mark as New
- Bookmark
- Subscribe
- Mute
- Subscribe to RSS Feed
- Permalink
- Report Inappropriate Content
Qliksense Align Values in centre
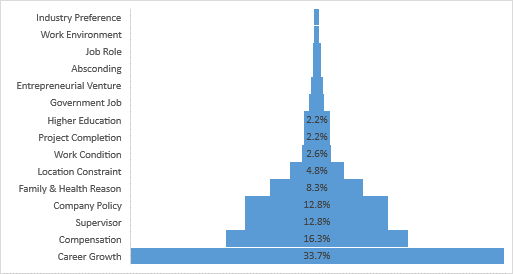
I want to create a graph in Qlik Sense, where plot area should be aligned to centre based on the values. Below is the example
any suggestions please
584 Views
2 Replies
Not applicable
2017-06-30
07:11 AM
Author
- Mark as New
- Bookmark
- Subscribe
- Mute
- Subscribe to RSS Feed
- Permalink
- Report Inappropriate Content
Tried with funnel chart as well , Not able to align values in center & based on the values graph is not ploting.
313 Views
Anonymous
Not applicable
2017-07-02
03:54 AM
Author
- Mark as New
- Bookmark
- Subscribe
- Mute
- Subscribe to RSS Feed
- Permalink
- Report Inappropriate Content
Hi Mahi,
Maybe try like this
Qlik Sense Waterfall Chart (No Extension)
Waterfall chart will gives you the same kind og representation.
Regards,
Sadasiva
313 Views
Community Browser