Unlock a world of possibilities! Login now and discover the exclusive benefits awaiting you.
- Qlik Community
- :
- Forums
- :
- Analytics
- :
- App Development
- :
- Qlik Sense : How to restrict graph for 5 years
- Subscribe to RSS Feed
- Mark Topic as New
- Mark Topic as Read
- Float this Topic for Current User
- Bookmark
- Subscribe
- Mute
- Printer Friendly Page
- Mark as New
- Bookmark
- Subscribe
- Mute
- Subscribe to RSS Feed
- Permalink
- Report Inappropriate Content
Qlik Sense : How to restrict graph for 5 years
Expression :
rangesum( below( count({ < EMP_HRIS = {"E"} >} [Emp Code]), 0, FYEAR))
-
count({<EMP_HRIS = {"L"} >} [Emp Code] )
Dimension : FYEAR
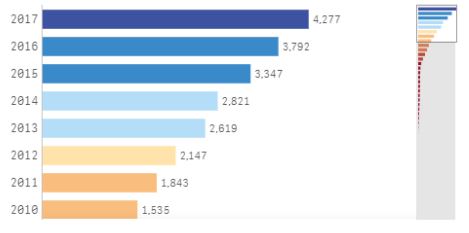
In the above graph I want to restrict to view only for 5 years ,
As my count is accumulating year wise , if I restrict at dimension (Year) level some data is missing see below screen shot.
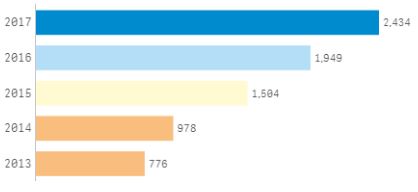
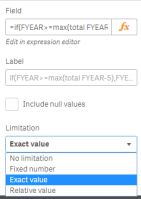
Dimension :
=if(FYEAR>=max(total FYEAR-5),FYEAR)
Using same Expression
Now it’s showing wrong values
- « Previous Replies
-
- 1
- 2
- Next Replies »
Accepted Solutions
- Mark as New
- Bookmark
- Subscribe
- Mute
- Subscribe to RSS Feed
- Permalink
- Report Inappropriate Content
Hi Mahi,
=if(FYEAR<max(Total FYEAR-4),max(Total FYEAR-4),FYEAR),
This will remove 2012.
Regards,
Sadasiva
- Mark as New
- Bookmark
- Subscribe
- Mute
- Subscribe to RSS Feed
- Permalink
- Report Inappropriate Content
Try the limitation option in dimension.
Keep it to Fixed 5.
and sort your chart by year dimension.
Regards,
Kaushik Solanki
- Mark as New
- Bookmark
- Subscribe
- Mute
- Subscribe to RSS Feed
- Permalink
- Report Inappropriate Content
This option is in Qlikview not in QlikSense....
Where is this option in Qlik Sense ?
- Mark as New
- Bookmark
- Subscribe
- Mute
- Subscribe to RSS Feed
- Permalink
- Report Inappropriate Content
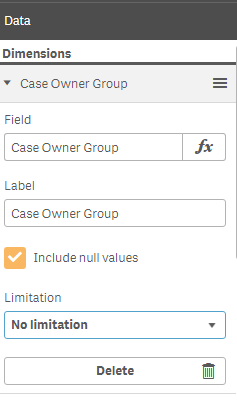
The option is under dimension.
Regards,
Kaushik Solanki
- Mark as New
- Bookmark
- Subscribe
- Mute
- Subscribe to RSS Feed
- Permalink
- Report Inappropriate Content
If I am using below options .. my Data is showing wrongly... see below graph which is showing wrong values.
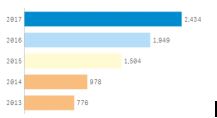
For 2017 count should be 4277 not 2434 , Pls see my expression (above) as count is accumulating per year
- Mark as New
- Bookmark
- Subscribe
- Mute
- Subscribe to RSS Feed
- Permalink
- Report Inappropriate Content
How about using this
=(RangeSum(Below(Count({< EMP_HRIS = {"E"} >} [Emp Code]), 0, FYEAR)) - Count({<EMP_HRIS = {"L"}>} [Emp Code])) * Avg({<Year = {"$(='<=' & (Max(FYEAR)-1) & '<=' & Max(FYEAR))"}>} 1)
- Mark as New
- Bookmark
- Subscribe
- Mute
- Subscribe to RSS Feed
- Permalink
- Report Inappropriate Content
Hi Mahi,
You are accumulating values from your business starting years, if you want to display latest 5, in your dimension you need to connsider all the years till 2013 as yr 2013, then the expression will give correct numbers.
Ex: if(FYEAR='2011' or FYEAR='2012' or FYEAR='2013','2013',FYEAR)
Regards,
Sadasiva
- Mark as New
- Bookmark
- Subscribe
- Mute
- Subscribe to RSS Feed
- Permalink
- Report Inappropriate Content
Its not working ,
Tried in other way... Its working ...
=if(FYEAR<max(Total FYEAR-4),max(Total FYEAR-4),FYEAR)
- Mark as New
- Bookmark
- Subscribe
- Mute
- Subscribe to RSS Feed
- Permalink
- Report Inappropriate Content
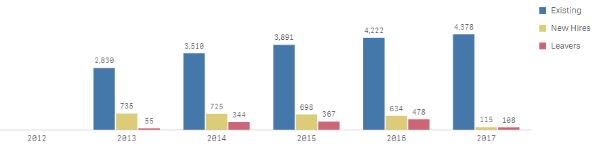
I am able to restrict for 5 years with the below code ... but additionally its showing 2012 year which I dont want to show in my graph , How to hide or avoid 2012 in the graph.
Dimension :
=if(FYEAR<max(Total FYEAR-5),max(Total FYEAR-5),FYEAR)
Expression:
Existing :
rangesum( above ( count({ < EMP_HRIS = {"E"} >} [Emp Code]), 1, FYEAR))
+
(
rangesum( below ( count({ < EMP_HRIS = {"L"} >} [Emp Code]), 0, FYEAR))
-
rangesum( below( count({ < EMP_HRIS = {"LJ"} >} [Emp Code]), 0, FYEAR))
)
Joiners:
(count({<EMP_HRIS = {"E"} >} [Emp Code] )
+
count({<EMP_HRIS = {"LJ"} >} [Emp Code] )
)
Leavers:
if( FYEAR>=max(Total FYEAR-5),
count({<EMP_HRIS = {"L"} >} [Emp Code] )
Kindly provide any suggestions here...
- Mark as New
- Bookmark
- Subscribe
- Mute
- Subscribe to RSS Feed
- Permalink
- Report Inappropriate Content
Hi Mahi,
=if(FYEAR<max(Total FYEAR-4),max(Total FYEAR-4),FYEAR),
This will remove 2012.
Regards,
Sadasiva
- « Previous Replies
-
- 1
- 2
- Next Replies »