Unlock a world of possibilities! Login now and discover the exclusive benefits awaiting you.
- Qlik Community
- :
- All Forums
- :
- QlikView App Dev
- :
- Combining dimensions into one in chart
- Subscribe to RSS Feed
- Mark Topic as New
- Mark Topic as Read
- Float this Topic for Current User
- Bookmark
- Subscribe
- Mute
- Printer Friendly Page
- Mark as New
- Bookmark
- Subscribe
- Mute
- Subscribe to RSS Feed
- Permalink
- Report Inappropriate Content
Combining dimensions into one in chart
I have the following data table:
| ID | Target | Current |
|---|---|---|
| 32456 | 1 | 3 |
| 9754 | 5 | 2 |
| 3215 | 6 | 4 |
| 7512 | 2 | 7 |
| 3254 | 4 | 5 |
'Target' and 'Current' share the same values.
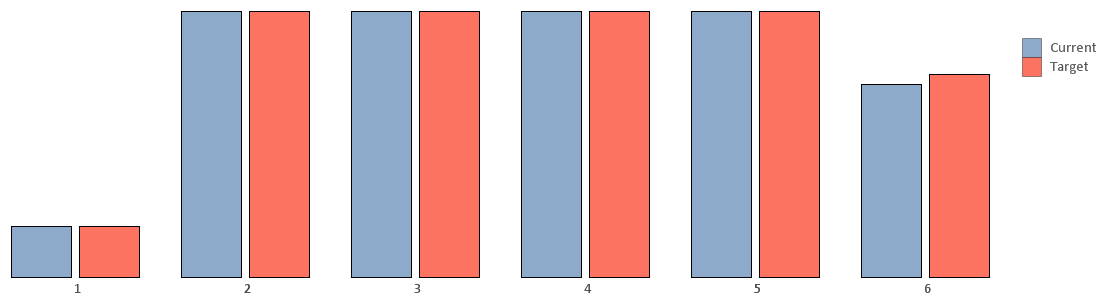
How can I create a chart like this, where I have COUNT(ID) as the expression, and the two dimensions as one?
- « Previous Replies
-
- 1
- 2
- Next Replies »
- Mark as New
- Bookmark
- Subscribe
- Mute
- Subscribe to RSS Feed
- Permalink
- Report Inappropriate Content
May be something like this
Load ID,
Target,
Current ,
Subfield(Key,'-') as Dim ;
Load
ID,
Target,
Current ,
Target&'-'&Current as Key
from table ;
Now use this dim in the chart for your calculation
- Mark as New
- Bookmark
- Subscribe
- Mute
- Subscribe to RSS Feed
- Permalink
- Report Inappropriate Content
Thanks for the response. Would there be anyway to do this directly in the chart?
I'm having real troubles getting a new dimension into the script:
- Mark as New
- Bookmark
- Subscribe
- Mute
- Subscribe to RSS Feed
- Permalink
- Report Inappropriate Content
Maybe something like this
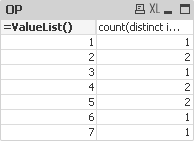
Dimension: ValueList($(=Concat(DISTINCT Current ,',')&','&Concat(DISTINCT Target ,',')))
Expression : count(distinct if(Current=ValueList($(=Concat(DISTINCT Current ,',')&','&Concat(DISTINCT Target ,','))), ID)) +
count(distinct if(Target=ValueList($(=Concat(DISTINCT Current ,',')&','&Concat(DISTINCT Target ,','))), ID))
- Mark as New
- Bookmark
- Subscribe
- Mute
- Subscribe to RSS Feed
- Permalink
- Report Inappropriate Content
Hello Jessica,
May be try below calculated dimension:
=Pick(Match($Field,'Target','Current'),[Target],[Current])
Regards!
Rahul Pawar
- Mark as New
- Bookmark
- Subscribe
- Mute
- Subscribe to RSS Feed
- Permalink
- Report Inappropriate Content
Thanks Rahul, but I still want to keep the 'Target' and 'Current' dimensions showing separately in the chart.
In your example, they are grouped together into one bar.
- Mark as New
- Bookmark
- Subscribe
- Mute
- Subscribe to RSS Feed
- Permalink
- Report Inappropriate Content
This looks as though it is grouping the two dimensions into one... I would like them to still show side by side.
- Mark as New
- Bookmark
- Subscribe
- Mute
- Subscribe to RSS Feed
- Permalink
- Report Inappropriate Content
Hi
can you explain what the dimension and expressions are, that will help in finding what you need and to give solution.
- Mark as New
- Bookmark
- Subscribe
- Mute
- Subscribe to RSS Feed
- Permalink
- Report Inappropriate Content
like this
Data:
LOAD ID,
Target as Value,
'Target' as Flag
FROM
[https://community.qlik.com/thread/268478?sr=stream&ru=186120]
(html, codepage is 1252, embedded labels, table is @1);
Concatenate
LOAD ID,
Current as Value,
'Current' as Flag
FROM
[https://community.qlik.com/thread/268478?sr=stream&ru=186120]
(html, codepage is 1252, embedded labels, table is @1);
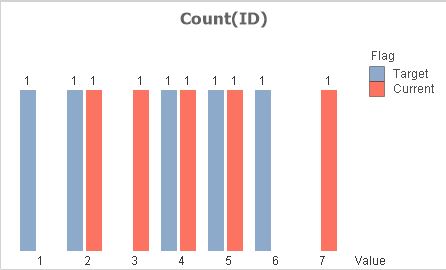
Create Bar chart
Dimension:
Value
Flag
Expression:
Count (ID)
- Mark as New
- Bookmark
- Subscribe
- Mute
- Subscribe to RSS Feed
- Permalink
- Report Inappropriate Content
Hi Krishna,
The dimensions are in the table here (so ID, Target, Current)
| ID | Target | Current |
|---|---|---|
| 32456 | 1 | 3 |
| 9754 | 5 | 2 |
| 3215 | 6 | 4 |
| 7512 | 2 | 7 |
| 3254 | 4 | 5 |
The expression is Count(ID)
So the table/Chart outcome I would want is:
| Count | Dimension 1 | Dimension 2 |
|---|---|---|
| 1 | 1 | Target |
| 0 | 1 | Current |
| 1 | 2 | Target |
| 1 | 2 | Current |
| 0 | 3 | Target |
| 1 | 3 | Current |
| 1 | 4 | Target |
| 1 | 4 | Current |
| 1 | 5 | Target |
| 1 | 5 | Current |
| 1 | 6 | Target |
| 0 | 6 | Current |
| 0 | 7 | Target |
| 1 | 7 | Current |
- « Previous Replies
-
- 1
- 2
- Next Replies »