Unlock a world of possibilities! Login now and discover the exclusive benefits awaiting you.
- Qlik Community
- :
- Forums
- :
- Analytics
- :
- App Development
- :
- In QlikSense, how to change a pie chart's measurem...
- Subscribe to RSS Feed
- Mark Topic as New
- Mark Topic as Read
- Float this Topic for Current User
- Bookmark
- Subscribe
- Mute
- Printer Friendly Page
- Mark as New
- Bookmark
- Subscribe
- Mute
- Subscribe to RSS Feed
- Permalink
- Report Inappropriate Content
In QlikSense, how to change a pie chart's measurement at run time?
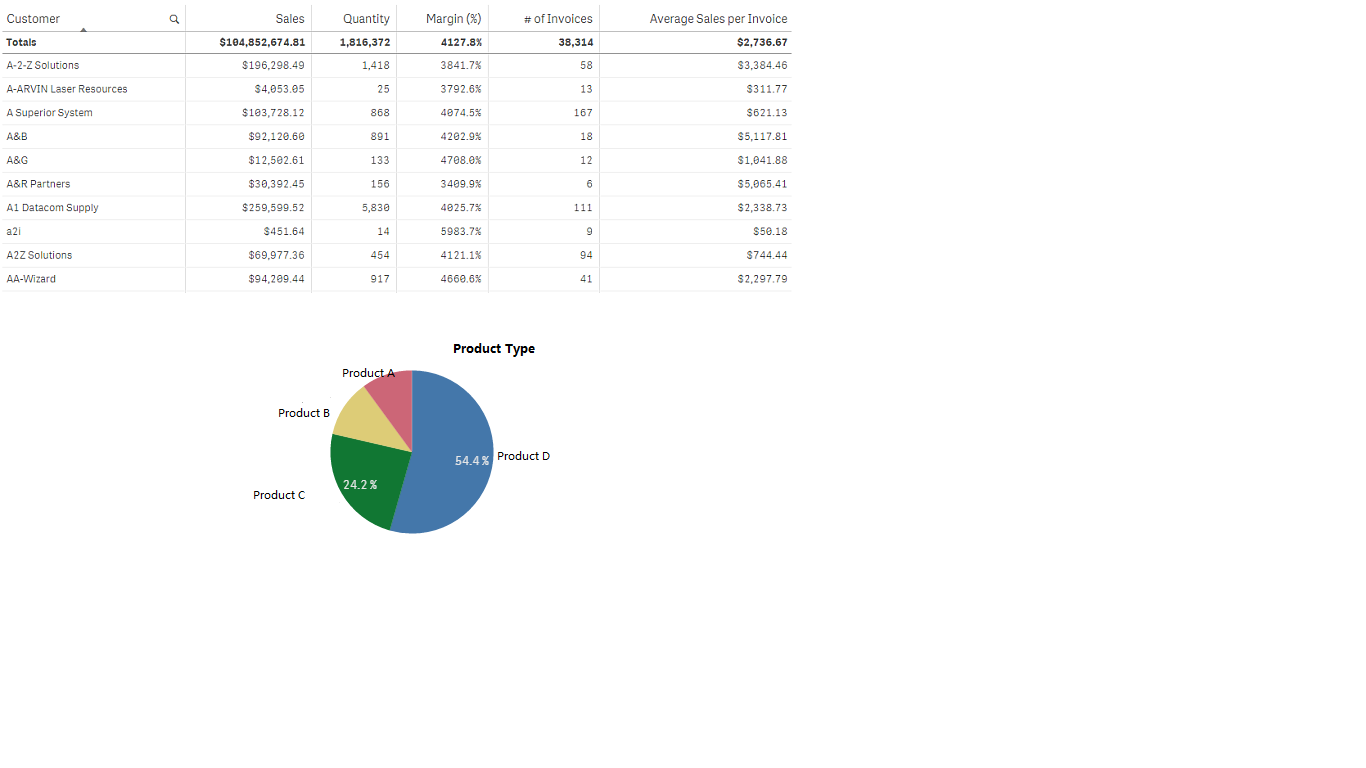
HI, my application's requirement is like this, a pie chart need to be displayed under a table, as depicted below.
When user click the "Sales" column for Customer "A-2-Z Solutions", the pie chart will show the percentage of sales amount for different products, and if user click the "Quantity" column, the measurement of the pie chart can be automatically changed to sales quantity.
I explore QlikSense a little bit, but yet can not find how the table can be aware which measurement column is clicked, and neither how to change a pie chart's measurement dynamically, could anyone shed some light on this? Thanks!
 ,
,
- Mark as New
- Bookmark
- Subscribe
- Mute
- Subscribe to RSS Feed
- Permalink
- Report Inappropriate Content
Qlik Sense does not support this.