Unlock a world of possibilities! Login now and discover the exclusive benefits awaiting you.
- Qlik Community
- :
- All Forums
- :
- QlikView App Dev
- :
- Request for an answer
- Subscribe to RSS Feed
- Mark Topic as New
- Mark Topic as Read
- Float this Topic for Current User
- Bookmark
- Subscribe
- Mute
- Printer Friendly Page
- Mark as New
- Bookmark
- Subscribe
- Mute
- Subscribe to RSS Feed
- Permalink
- Report Inappropriate Content
Request for an answer
Hi,
As per the data loaded, once the growth rate was computed, the results generated are in order except the growth rate on MR & TT classes.The issue here is as we generally encounter even in Excel where the growth rate becomes negative even if the current Year figure looks positive over a negative figure in the corresponding last Year. Look forward for a remedy to overcome this. As can be seen below, said two classes have taken a negative growth rate which of course to be positive. How this could be tackled in qlik view.

Neville.
- Tags:
- qlikview
Accepted Solutions
- Mark as New
- Bookmark
- Subscribe
- Mute
- Subscribe to RSS Feed
- Permalink
- Report Inappropriate Content
if (CY > LY, fabs(Growth),Growth)
I managed to get my results by applying the above formula.
Thanks
Neville
- Mark as New
- Bookmark
- Subscribe
- Mute
- Subscribe to RSS Feed
- Permalink
- Report Inappropriate Content
Hi Neville,
See if this suits you.
Sample:
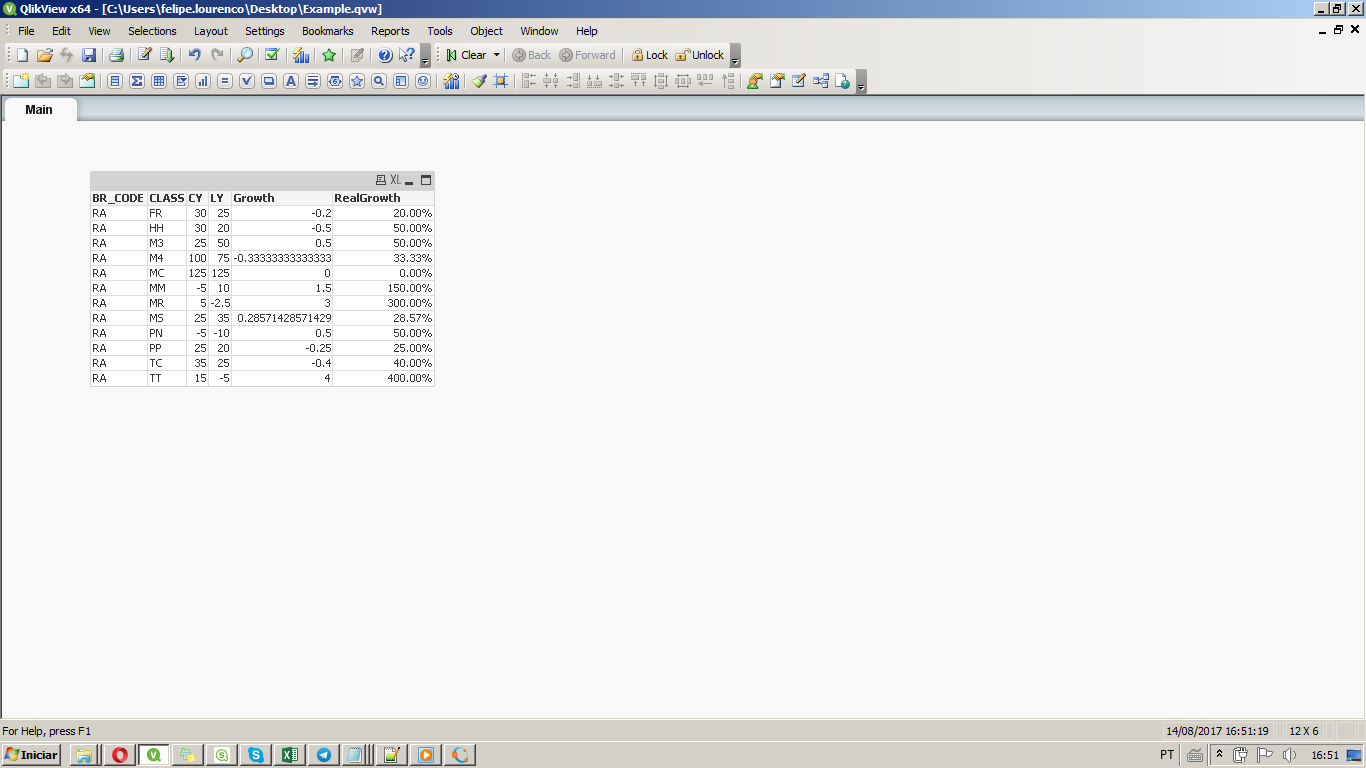
LOAD * Inline
[
BR_CODE,CLASS,CY,LY
RA,FR,30,25
RA,HH,30,20
RA,M3,25,50
RA,M4,100,75
RA,MC,125,125
RA,MR,5,-2.5
RA,MS,25,35
RA,PP,25,20
RA,TC,35,25
RA,TT,15,-5
RA,MM,-5,10
RA,PN,-5,-10
];
Data:
Load
*,
if (CY > LY, fabs(Growth),Growth) as RealGrowth;
Load
*,
(1 - CY/LY) as Growth
Resident Sample;
drop table Sample;
This gives me the bellow image
- Mark as New
- Bookmark
- Subscribe
- Mute
- Subscribe to RSS Feed
- Permalink
- Report Inappropriate Content
Dear Felip,
Is there other way forward?. You mean to load inline with resulted figures? such as growth rate received in data load as it is. Could you please suggest a formula in expression?. Can this formula be applied in expression?
Neville
- Mark as New
- Bookmark
- Subscribe
- Mute
- Subscribe to RSS Feed
- Permalink
- Report Inappropriate Content
May be number format for 3rd expression like (#,#00);(#,##0)
- Mark as New
- Bookmark
- Subscribe
- Mute
- Subscribe to RSS Feed
- Permalink
- Report Inappropriate Content
Dear Felip, Your expression as suggested below did work, Thanks a lot. I simply applied it as an expression in the Pivot table which produced the results I expected.
if (CY > LY, fabs(Growth),Growth)
Neville
- Mark as New
- Bookmark
- Subscribe
- Mute
- Subscribe to RSS Feed
- Permalink
- Report Inappropriate Content
Good to hear it helped Neville  ,
,
Can you mark the correct answer please.
Thanks
- Mark as New
- Bookmark
- Subscribe
- Mute
- Subscribe to RSS Feed
- Permalink
- Report Inappropriate Content
if (CY > LY, fabs(Growth),Growth)
I managed to get my results by applying the above formula.
Thanks
Neville