Unlock a world of possibilities! Login now and discover the exclusive benefits awaiting you.
- Qlik Community
- :
- Forums
- :
- Analytics
- :
- New to Qlik Analytics
- :
- Linear Average: Year Comparison
Options
- Subscribe to RSS Feed
- Mark Topic as New
- Mark Topic as Read
- Float this Topic for Current User
- Bookmark
- Subscribe
- Mute
- Printer Friendly Page
Turn on suggestions
Auto-suggest helps you quickly narrow down your search results by suggesting possible matches as you type.
Showing results for
Anonymous
Not applicable
2017-08-21
06:32 PM
- Mark as New
- Bookmark
- Subscribe
- Mute
- Subscribe to RSS Feed
- Permalink
- Report Inappropriate Content
Linear Average: Year Comparison
Hello,
I would like to make a linear average line for each of the two years I am comparing on the same chart. Below I have the current year and prior year trend lines. I would like a linear average for each of the years.
My current expressions are:
RangeSum(Above(TOTAL Sum({<[Date.autoCalendar.YearsAgo] = {0}>} Amount) ,0,RowNo(TOTAL)))/1000
RangeSum(Above(TOTAL Sum({<[Date.autoCalendar.YearsAgo] = {1}>} Amount) ,0,RowNo(TOTAL)))/1000
And my dimension is:
=Num(Week(Date(Date)-YearStart(Date)+1,00))
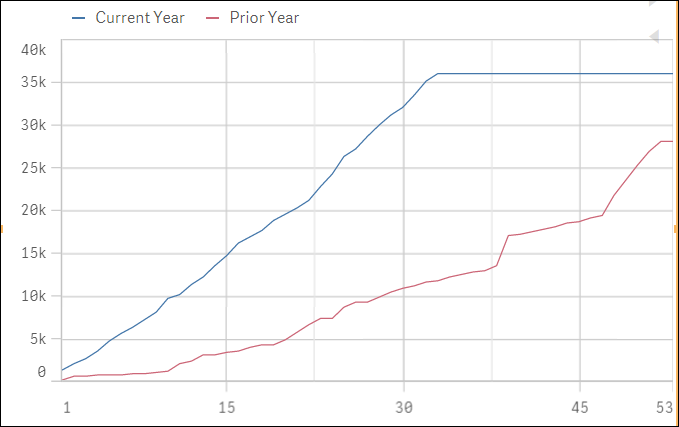
As a bonus item, I would also like to remove the flat line at the top of the Current Year. Thank you for your help.
Regards,
219 Views
0 Replies
Community Browser