Unlock a world of possibilities! Login now and discover the exclusive benefits awaiting you.
- Qlik Community
- :
- Forums
- :
- Analytics
- :
- New to Qlik Analytics
- :
- How to report totals on last day of each period, g...
- Subscribe to RSS Feed
- Mark Topic as New
- Mark Topic as Read
- Float this Topic for Current User
- Bookmark
- Subscribe
- Mute
- Printer Friendly Page
- Mark as New
- Bookmark
- Subscribe
- Mute
- Subscribe to RSS Feed
- Permalink
- Report Inappropriate Content
How to report totals on last day of each period, generically
In the attached spreadsheet, I have forecast and actual headcounts for each day of the billing/fiscal year 2017. Actual headcount values are available through the current date (8/22/2017), while forecast headcount values are available through the end of the year.
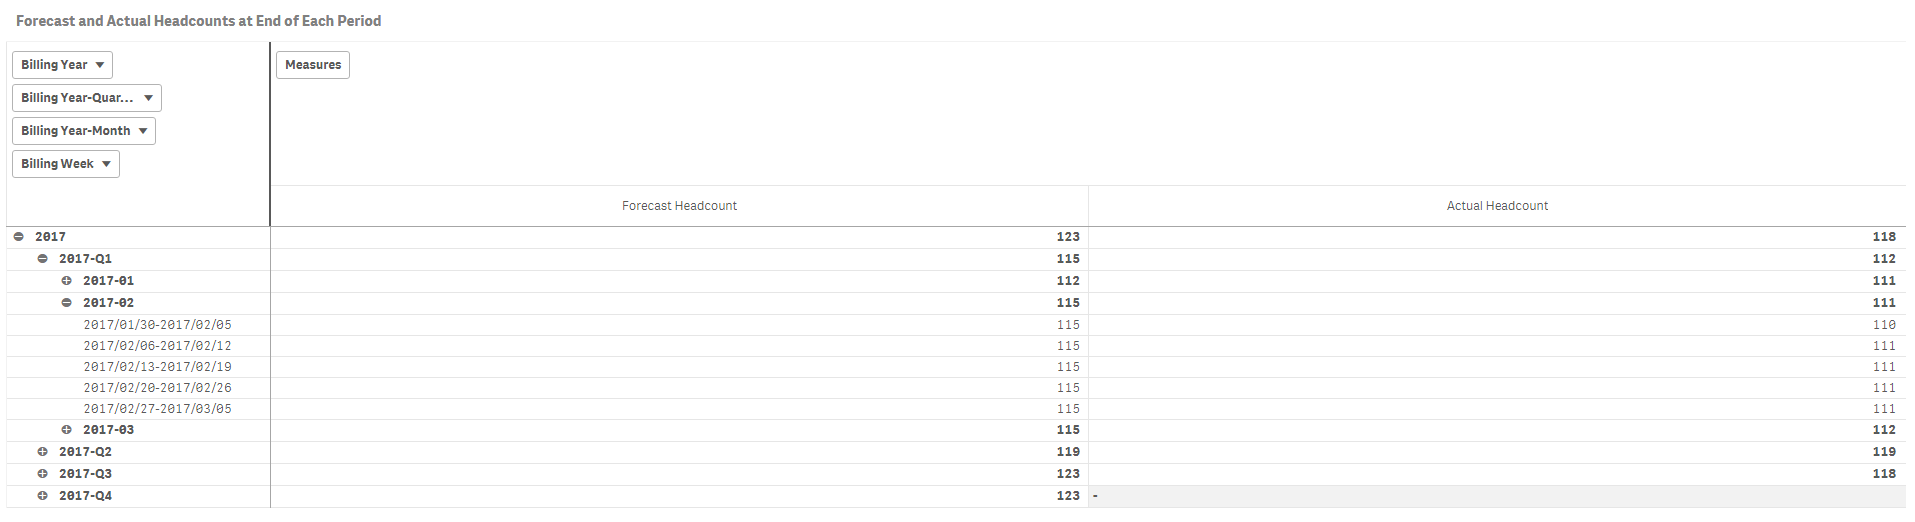
The pivot table below (from attached app) reports the sum of all headcounts for each period. However, this is not what I want; the numbers are inflated because they reflect the sum of the headcount of every day in each period. What I'm looking for is the headcount of the last day in each visible period, whether at the year, quarter, month, or week level. Additionally, for the Actual Headcount, if today's date falls before the last day of the period, I want the Actual Headcount to be for today's date, not the end of the period.
.png)
I've tried many approaches: Max, Aggr, FirstSortedValue, TOTAL, etc., and have visited a number of community posts, but none of them seem to address this fairly simple and reasonable (but elusive) requirement.
Any approach that hard-codes the period type won't work (e.g., AGGR, which requires a pre-specified period type to group by, like month or quarter), since the report needs to adjust dynamically to the display context, whether it's at the year, quarter, month, or week level.
In pseudo-code, here's what I'd like to implement:
For forecast headcount:
If (the date of a record = max(date) of period in the reporting row)
Then sum(forecast headcount)
Else 0
End
For actual headcount:
If (the date of a record = the earlier of {today's date OR max(date of period in the reporting row})
Then sum(actual headcount)
Else 0
End
Accepted Solutions
- Mark as New
- Bookmark
- Subscribe
- Mute
- Subscribe to RSS Feed
- Permalink
- Report Inappropriate Content
I am a little lost, but is the attached file give you what you want
- Mark as New
- Bookmark
- Subscribe
- Mute
- Subscribe to RSS Feed
- Permalink
- Report Inappropriate Content
Are you envisioning something like this
- Mark as New
- Bookmark
- Subscribe
- Mute
- Subscribe to RSS Feed
- Permalink
- Report Inappropriate Content
Thanks so much, Sunny! Apologies for the delayed response; the email notice fell victim to my spam filter.
Yes, your solution is what I was looking for in the context of the data I provided; I was close but hadn't arrived at the correct FirstSortedValue/AGGR combination.
There are two remaining issues I'll need to resolve before I can use this in our production environment:
1) The "Today()"-based date filter for the Actual Headcount column doesn't work in my server environment; notice in my screenshot below it shows "0" for the 2017-Q3 row, whereas in your screenshot it properly shows 119. Date format issues like this have always puzzled me; any insight you could provide would be much appreciated.
My load script includes these date/time formats:
SET TimeFormat='h:mm:ss TT';
SET DateFormat='M/D/YYYY';
SET TimestampFormat='M/D/YYYY h:mm:ss[.fff] TT';
Here's the measure you defined for "Actual Headcount":
FirstSortedValue({<Date = {"$(='<=' & Date(Today()))"}>}Aggr(Sum([Actual Headcount]), Date), -Date)
Here are two other approaches I tried, neither of which worked:
FirstSortedValue({<[Date Number] = {"$(='<=' & Num(Date(Today())))"}>}Aggr(Sum([Actual Headcount]), [Date Number]), -[Date Number])
FirstSortedValue({<Date = {"$(='<=' & Date(Today(),'M/D/YYYY h:mm:ss[.fff] TT'))"}>}Aggr(Sum([Actual Headcount]), Date), -Date)
Here's what my table looks with your measure; note the 0 for 2017-Q3, etc:
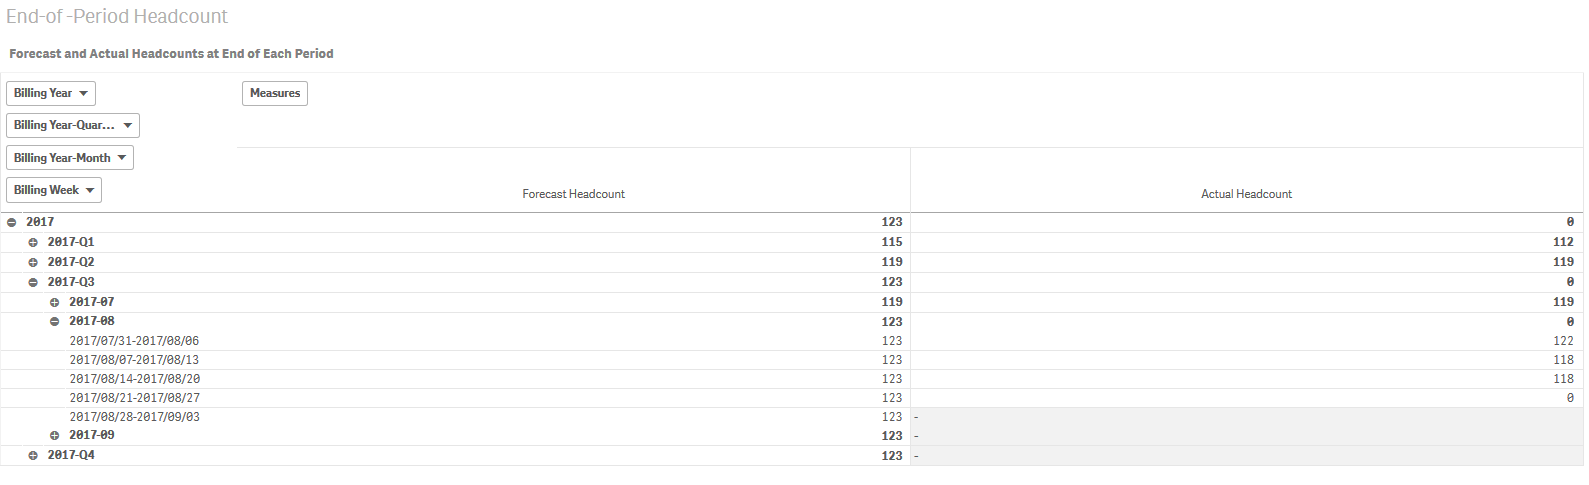
2) The data set I provided was simplified and included only one headcount data row per date. In our production environment, the data will be segmented by office, so there will be multiple rows per date. The FirstSortedValue returns NULL when there are multiple rows per sort item (in this case Date). When I add an Office column and include a row per office per date, I end up with NULL results.
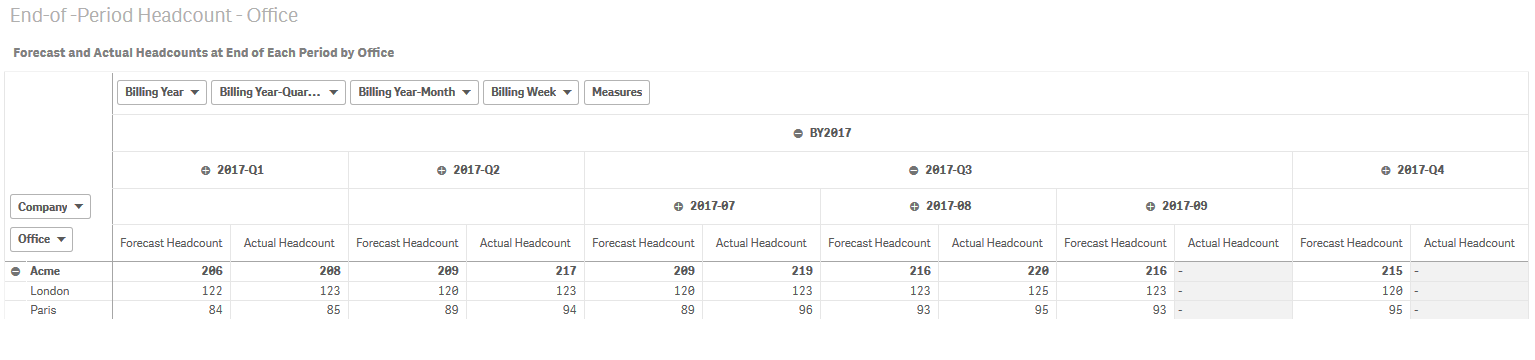
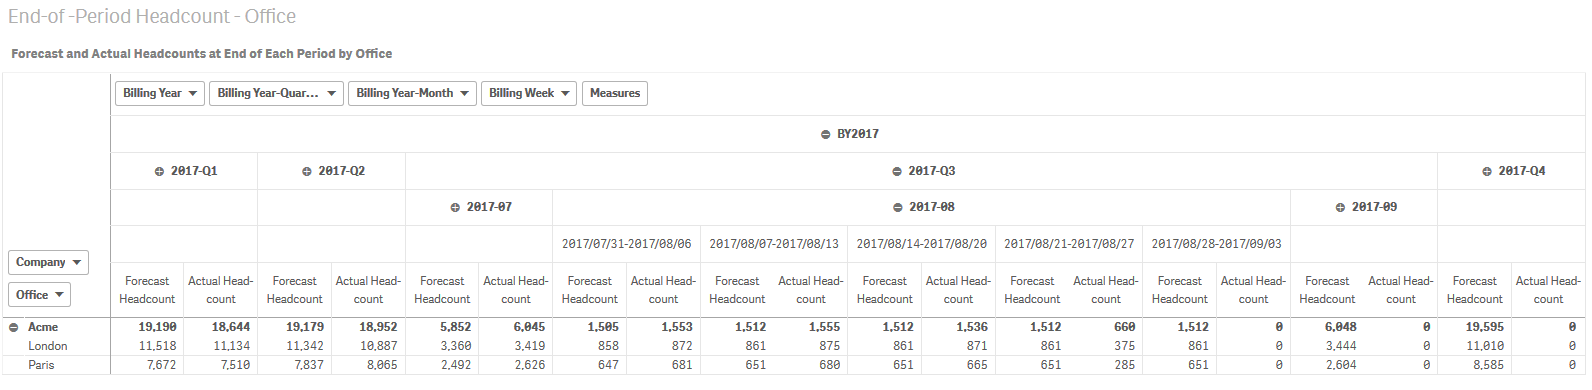
I've revised my app and the source spreadsheet (see attached) to include two offices: Paris and London (in our production context, there will be more than two offices). See screenshot below showing desired drill-down functionality. I would like to drill down from wider to narrower date periods on the top and from company (Acme) to office on the left. Again, my screenshot (incorrectly) shows the sum of headcounts for all days within each period; my objective instead is to report only the headcounts for the final day of each period, regardless of the type of period.
Do you have any suggestions for how to proceed? Again, your expertise and time is much appreciated.
Ken
- Mark as New
- Bookmark
- Subscribe
- Mute
- Subscribe to RSS Feed
- Permalink
- Report Inappropriate Content
I am a little lost, but is the attached file give you what you want
- Mark as New
- Bookmark
- Subscribe
- Mute
- Subscribe to RSS Feed
- Permalink
- Report Inappropriate Content
Sunny,
This is great--it's exactly what I was looking for! Thanks so much for taking the time to develop a solution. I trust others will also find it useful.
For those who'd like to see Sunny's formulas without having to load the app, here there are:
Forecast Headcount:
If(Dimensionality() = 1, FirstSortedValue(Aggr(Sum([Forecast Headcount]), Date, Company), -Aggr(Date, Date, Company))
,FirstSortedValue(Aggr(Sum([Forecast Headcount]), Date, Company, Office), -Aggr(Date, Date, Company, Office)))
Actual Headcount:
If(Dimensionality() = 1, FirstSortedValue({<Date = {"$(='<=' & Date(Today()))"}>}Aggr(Sum([Actual Headcount]), Date, Company), -Aggr(Date, Date, Company))
,FirstSortedValue({<Date = {"$(='<=' & Date(Today()))"}>}Aggr(Sum([Actual Headcount]), Date, Company, Office), -Aggr(Date, Date, Company, Office)))
And here's a sample image of the pivot table, showing the company (Acme) and office (London and Paris) headcounts for the end of each quarter, with 2017-Q3 expanded to show the end-of-month headcounts for Q3: