Unlock a world of possibilities! Login now and discover the exclusive benefits awaiting you.
- Qlik Community
- :
- Forums
- :
- Analytics
- :
- New to Qlik Analytics
- :
- Formatting milisecond intervals in charts
- Subscribe to RSS Feed
- Mark Topic as New
- Mark Topic as Read
- Float this Topic for Current User
- Bookmark
- Subscribe
- Mute
- Printer Friendly Page
- Mark as New
- Bookmark
- Subscribe
- Mute
- Subscribe to RSS Feed
- Permalink
- Report Inappropriate Content
Formatting milisecond intervals in charts
Hi All,
I'm struggling with formatting milisecond intervals in charts. It either does not work at all (shows only zeros) or work wrongly (strange numbers appear).
To reproduce the problem you can load the exemplary data:
[test]:
LOAD Id AS ID, Timestamp(Miliseconds/24/60/60/1000, 's.fff') AS timestamp INLINE [
Id, Miliseconds
1, 1
2, 7
3, 48
4, 35
5, 56
6, 100
]
Then I create a table just to show the data is loaded properly:
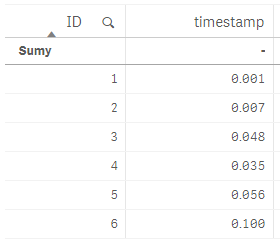
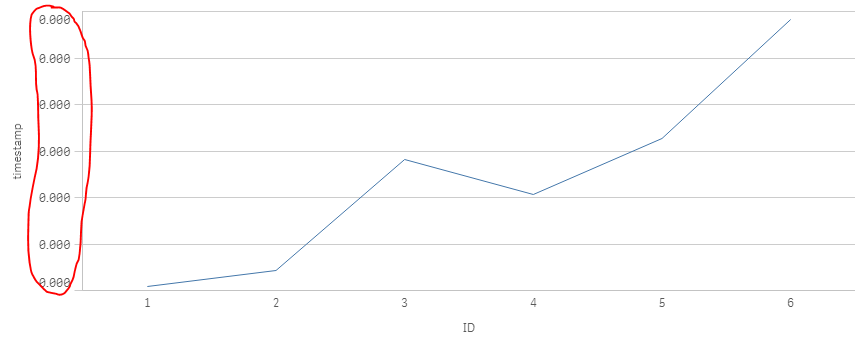
But when I create a line chart, I get all 0.000s on the Y-scale (this is with automatic formatting):
When I overwrite the formatting in Data->timestamp->formatting from "automatic" to "interval", and type in 's.fff' it gets even worse:
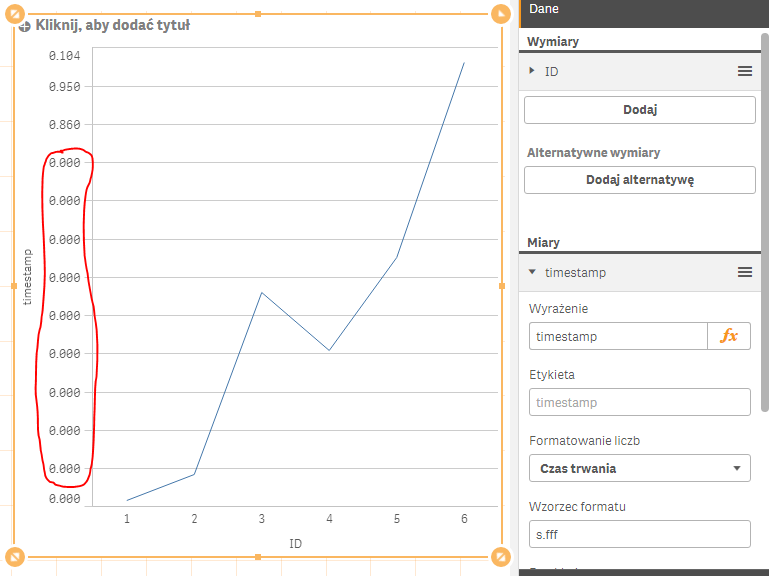
The values on the charts are correct. It's just the scale which is all zeros.
Do you have any idea how to overcome this issue?
In the attachment you will find the application with the described behavior.
Thanks in Advance
Mateusz
- Tags:
- formatting dates