Unlock a world of possibilities! Login now and discover the exclusive benefits awaiting you.
- Qlik Community
- :
- Forums
- :
- Analytics
- :
- New to Qlik Analytics
- :
- Growth KPI's calculation on line chart for continu...
- Subscribe to RSS Feed
- Mark Topic as New
- Mark Topic as Read
- Float this Topic for Current User
- Bookmark
- Subscribe
- Mute
- Printer Friendly Page
- Mark as New
- Bookmark
- Subscribe
- Mute
- Subscribe to RSS Feed
- Permalink
- Report Inappropriate Content
Growth KPI's calculation on line chart for continuous years
Hello Experts,
Can some one please help in how to calculate Growth KPIs ( Year-1, Period -1, CAGR) in qlik sense expression.
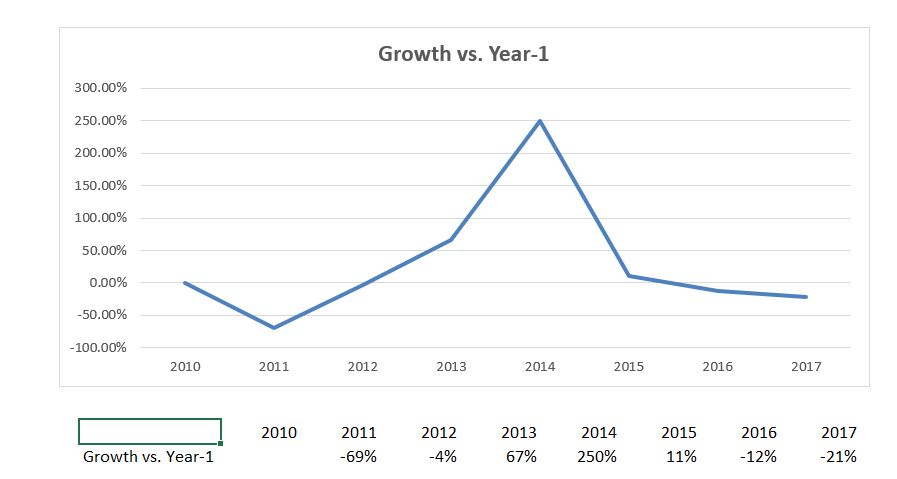
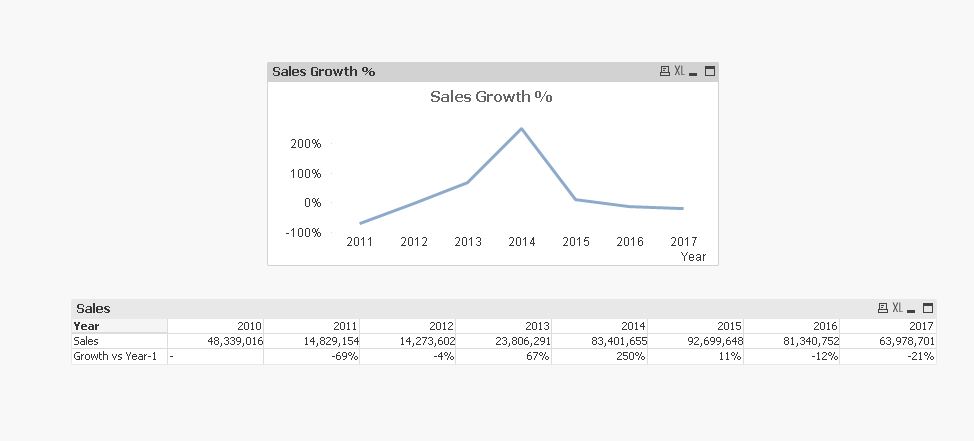
Following is my data schema , screen shot of visualization requirement .
| Product | Year | Sales |
| A | 2010 | 4,83,39,016 |
| A | 2011 | 1,48,29,154 |
| A | 2012 | 1,42,73,602 |
| A | 2013 | 2,38,06,291 |
| A | 2014 | 8,34,01,655 |
| A | 2015 | 9,26,99,648 |
| A | 2016 | 8,13,40,752 |
| A | 2017 | 6,39,78,701 |
Thanks,
Kranthi
- Mark as New
- Bookmark
- Subscribe
- Mute
- Subscribe to RSS Feed
- Permalink
- Report Inappropriate Content
Hi,
you can try like this
Sales Growth Expression (year sorting will be ascending order)
Sum(Sales)/Above(Sum(Sales)) - 1 // line graph chart expression
Sum(Sales)/Before(Sum(Sales)) - 1 //for pivot table chart expression
- Mark as New
- Bookmark
- Subscribe
- Mute
- Subscribe to RSS Feed
- Permalink
- Report Inappropriate Content
Hello Devarasu,
Thanks for the quick reply, the approach works for the single dimension data.
However, when we include more attributes like region, country and area,... to the data and filter options the formulea behaves randomely.
Regards,
Kranthi
- Mark as New
- Bookmark
- Subscribe
- Mute
- Subscribe to RSS Feed
- Permalink
- Report Inappropriate Content
The other option is to use The As-Of Table
Updated devarasu07's attached sample with the asoftable approach