Unlock a world of possibilities! Login now and discover the exclusive benefits awaiting you.
- Qlik Community
- :
- All Forums
- :
- QlikView App Dev
- :
- Show percentage in pivot table
- Subscribe to RSS Feed
- Mark Topic as New
- Mark Topic as Read
- Float this Topic for Current User
- Bookmark
- Subscribe
- Mute
- Printer Friendly Page
- Mark as New
- Bookmark
- Subscribe
- Mute
- Subscribe to RSS Feed
- Permalink
- Report Inappropriate Content
Show percentage in pivot table
Hi all
I want to do a pivot table with two dimension: year and age.
I want to show the percentage of people in a certain age-group within every year for the people in my population with foreign nationality, like this:
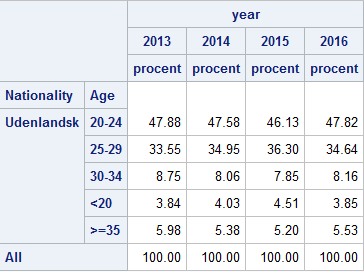
I know how to calculate the number of people within each group using the function
=count( {< [Nationality]={'Udenlandsk'} >} Person_id)
But how do I get QV to show the percentage in stead, like in the example above?
I already tried:
= count( {< [Nationality]={'Udenlandsk'} >} Person_id) / count(total {< [Nationality]={'Udenlandsk'} >} Person_id)
But this doesn't give the percentage I want.
Kind Regards
Maria
Accepted Solutions
- Mark as New
- Bookmark
- Subscribe
- Mute
- Subscribe to RSS Feed
- Permalink
- Report Inappropriate Content
Use the TOTAL qualifier with a field list:
= count( {< [Nationality]={'Udenlandsk'} >} Person_id) / count(total<year> {< [Nationality]={'Udenlandsk'} >} Person_id)
assuming year is the field name for your year dimension.
- Mark as New
- Bookmark
- Subscribe
- Mute
- Subscribe to RSS Feed
- Permalink
- Report Inappropriate Content
This was just what I was looking for. Thanks a lot!