Unlock a world of possibilities! Login now and discover the exclusive benefits awaiting you.
- Qlik Community
- :
- Forums
- :
- Analytics
- :
- New to Qlik Analytics
- :
- Do not have 'empty name' in the data but have 'emp...
- Subscribe to RSS Feed
- Mark Topic as New
- Mark Topic as Read
- Float this Topic for Current User
- Bookmark
- Subscribe
- Mute
- Printer Friendly Page
- Mark as New
- Bookmark
- Subscribe
- Mute
- Subscribe to RSS Feed
- Permalink
- Report Inappropriate Content
Do not have 'empty name' in the data but have 'empty' fields in the bar chart
Hi,
I am creating a bar chart using 'ProductName' showing belong. having the longest bar as '_' with out name
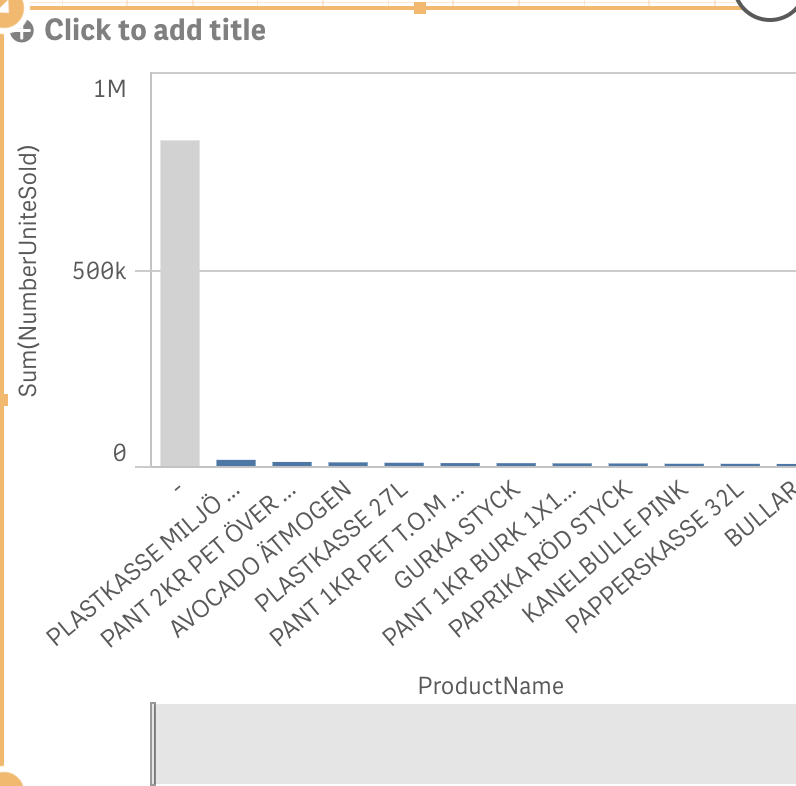
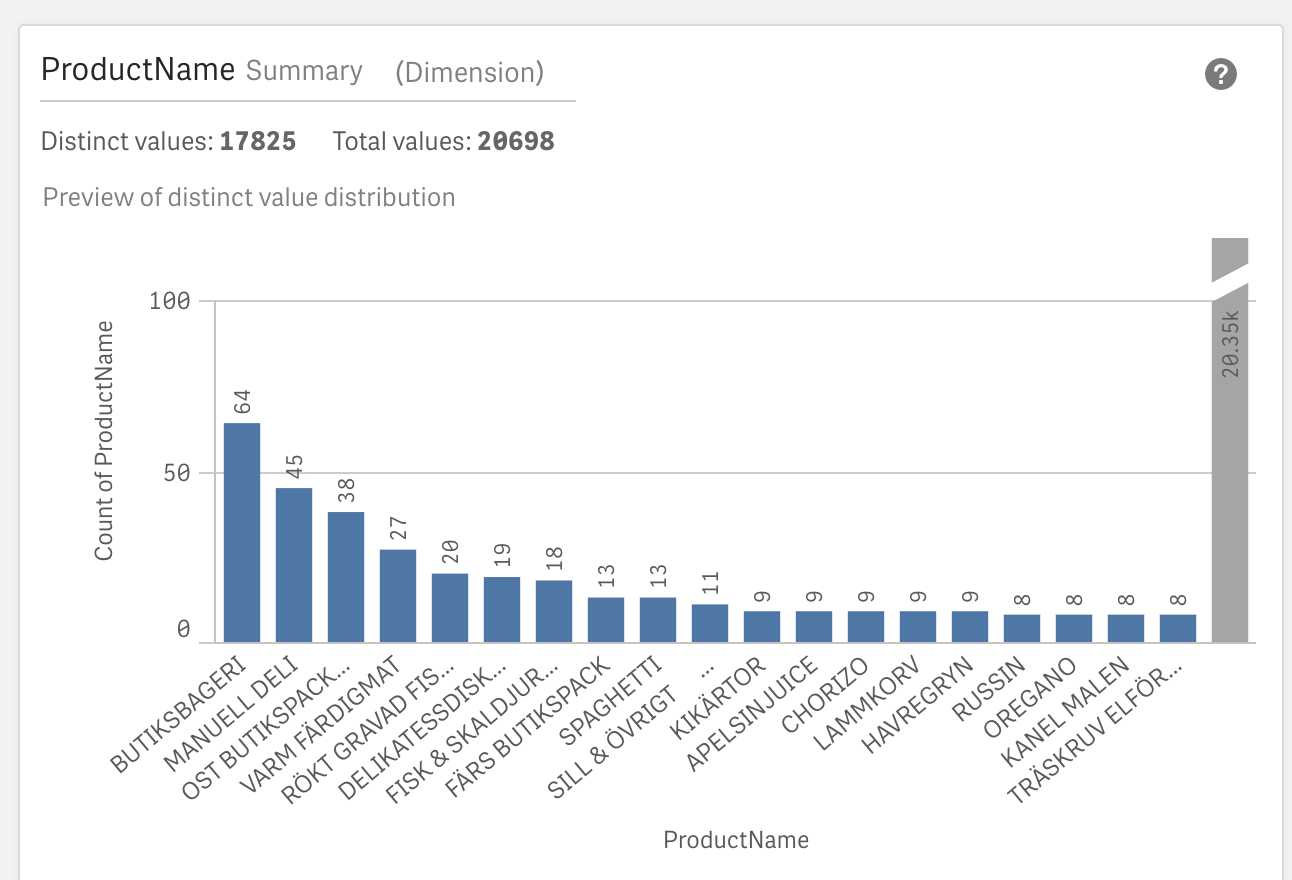
But when i check the data manager, I did not find any '_' (empty name here), showing below
any suggestion regarding possible reason and any solutions?
thank you!
- « Previous Replies
-
- 1
- 2
- Next Replies »
Accepted Solutions
- Mark as New
- Bookmark
- Subscribe
- Mute
- Subscribe to RSS Feed
- Permalink
- Report Inappropriate Content
First you may try to uncheck the 'Include null values' checkbox.
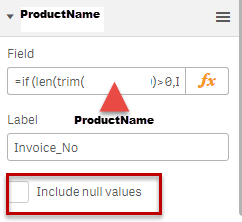
Occasionally, you may get values that do not appear as nulls but are 'empty'. You may use this script in your chart dimension to have those values not shown:
= if (len(trim(ProductName))>0,ProductName)
This is a simple if/then statement that says, if the string length of the value for ProductName is anything over 0, show me ProductName. So the rows that have no value should not be returned and therefore not shown in the chart.
- Mark as New
- Bookmark
- Subscribe
- Mute
- Subscribe to RSS Feed
- Permalink
- Report Inappropriate Content
hi
the most right column in the data manager , is empty name the gray bar
- Mark as New
- Bookmark
- Subscribe
- Mute
- Subscribe to RSS Feed
- Permalink
- Report Inappropriate Content
Yes. But When I try to find the row --which realted to the 'Empty' name back in the data set. I did not find any row have 'Empty' name.
That is why I feel strange.
in data set I have no row with empty 'product name'
why in the Bar chart i have that Grey bar????
- Mark as New
- Bookmark
- Subscribe
- Mute
- Subscribe to RSS Feed
- Permalink
- Report Inappropriate Content
Hi Celine,
Is it possible to upload an example of the data that you are loading?
Thanks,
Simon
- Mark as New
- Bookmark
- Subscribe
- Mute
- Subscribe to RSS Feed
- Permalink
- Report Inappropriate Content
I can try but, if that is sample I am not sure. it till have this problem
- Mark as New
- Bookmark
- Subscribe
- Mute
- Subscribe to RSS Feed
- Permalink
- Report Inappropriate Content
Ok, perhaps the qvf then?
thanks,
Simon
- Mark as New
- Bookmark
- Subscribe
- Mute
- Subscribe to RSS Feed
- Permalink
- Report Inappropriate Content
re. the summary view:
- Preview of distinct value distribution: In fields with more than 20 distinct values, only the 20 distinct values with the highest count display. All other values are grouped into a single value on the chart. If all values are distinct, no bar chart will display.
I think the issue here will likely be the way your data is associated. Are you pulling from different datasources to get the product names, and number sold? If so, how are you linking them?
Thanks,
Simon
- Mark as New
- Bookmark
- Subscribe
- Mute
- Subscribe to RSS Feed
- Permalink
- Report Inappropriate Content
Yes. different data source.
but if i use R processing, it is one to one relationship between Product ID and Product Name
But if I use Qlik to join--in the data manager is not not right
showing NA rows after join
- Mark as New
- Bookmark
- Subscribe
- Mute
- Subscribe to RSS Feed
- Permalink
- Report Inappropriate Content
Thank you here. I use R to pre join the datasets. then it is fine now. But still did not know what happened in Qlik.
- Mark as New
- Bookmark
- Subscribe
- Mute
- Subscribe to RSS Feed
- Permalink
- Report Inappropriate Content
Hi,
It is likely how they are being joined.
Are you purely using the data manager and joining the bubbles together, or using the data load editor to script the join?
Can you sharean example of the script?
Thanks,
Simon
- « Previous Replies
-
- 1
- 2
- Next Replies »