Unlock a world of possibilities! Login now and discover the exclusive benefits awaiting you.
- Qlik Community
- :
- All Forums
- :
- QlikView App Dev
- :
- Stacked line charts with single value nothing is d...
- Subscribe to RSS Feed
- Mark Topic as New
- Mark Topic as Read
- Float this Topic for Current User
- Bookmark
- Subscribe
- Mute
- Printer Friendly Page
- Mark as New
- Bookmark
- Subscribe
- Mute
- Subscribe to RSS Feed
- Permalink
- Report Inappropriate Content
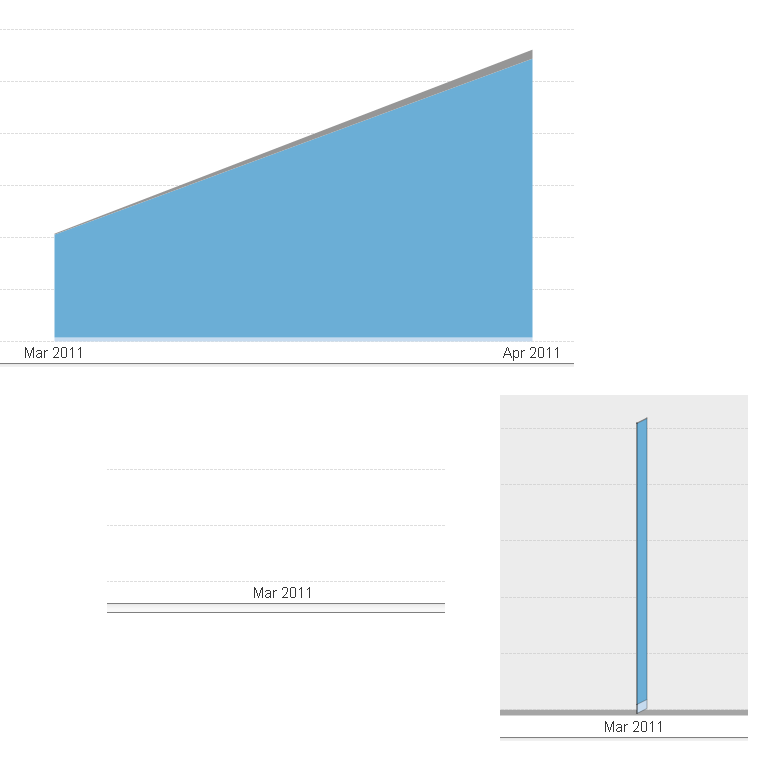
Stacked line charts with single value nothing is drawn
Using stacked line charts and when user selects down to a single month nothing is drawn. If switch to 3D style then a line is drawn. I would expect this to work with non-3D also. See screen shots. Also, is there a way when there is a single value to force QV to draw using 0 to that value?
- Mark as New
- Bookmark
- Subscribe
- Mute
- Subscribe to RSS Feed
- Permalink
- Report Inappropriate Content
Hmmm, looks like a bug to me. For a normal line chart, when you select only a single X-value, it changes from lines to symbols so that you can still see the data. It looks like when you fill in with a color, it doesn't do that, nor does it do anything else useful, so your data disappears. Even explicitly telling it to use symbols appears to do nothing.