Unlock a world of possibilities! Login now and discover the exclusive benefits awaiting you.
- Qlik Community
- :
- Forums
- :
- Analytics
- :
- New to Qlik Analytics
- :
- Qlik Sense - Custom color a stacked bar chart
- Subscribe to RSS Feed
- Mark Topic as New
- Mark Topic as Read
- Float this Topic for Current User
- Bookmark
- Subscribe
- Mute
- Printer Friendly Page
- Mark as New
- Bookmark
- Subscribe
- Mute
- Subscribe to RSS Feed
- Permalink
- Report Inappropriate Content
Qlik Sense - Custom color a stacked bar chart
Hello,
How do you custom color a stacked bar chart? I would like Revenue to be dark blue and Operating Income to be light blue.
I have one dimension:
1. Product Line
I have two measures:
1. Revenue
2. Operating Income
Any advice here would be great.
I have tried a previous fix on this community by adding a second dimension and using valuelist to call out the measures to color-code them, but in this process, we lose the functionality of hovering over the bars and seeing the revenue or operating income on the chart.
Thanks so much.
- Tags:
- qlik sense
- Mark as New
- Bookmark
- Subscribe
- Mute
- Subscribe to RSS Feed
- Permalink
- Report Inappropriate Content
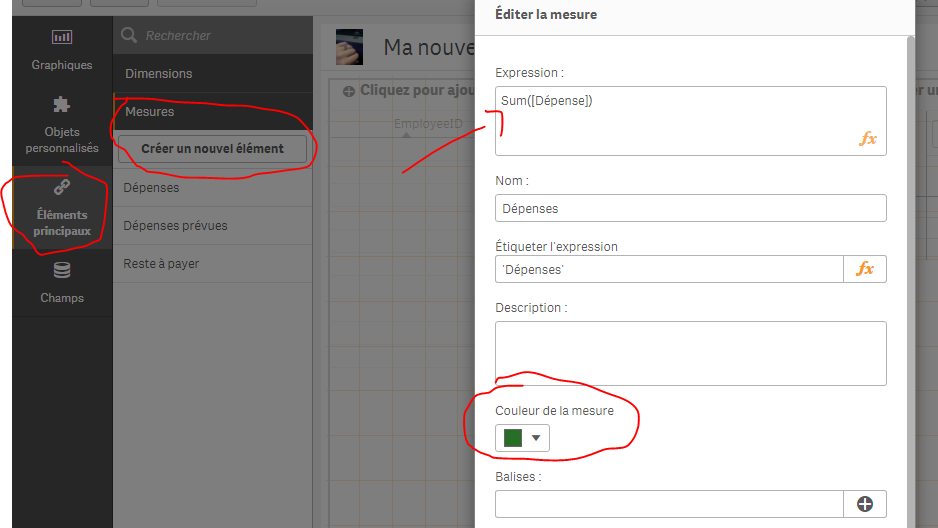
if u have a new version of qlik sense (june, september , november or even 3.2.x I think), u can create ur 2 measures as master measures and assign colors to them and there u have what u're looking for !
- Mark as New
- Bookmark
- Subscribe
- Mute
- Subscribe to RSS Feed
- Permalink
- Report Inappropriate Content
Did this resolve ur problem? rglenn0780
- Mark as New
- Bookmark
- Subscribe
- Mute
- Subscribe to RSS Feed
- Permalink
- Report Inappropriate Content
working through it today and will assign if it is correct after I try it out. Will keep you posted. Thanks
- Mark as New
- Bookmark
- Subscribe
- Mute
- Subscribe to RSS Feed
- Permalink
- Report Inappropriate Content
There also is a good extension that will do this called 'Bars Plus'
- Mark as New
- Bookmark
- Subscribe
- Mute
- Subscribe to RSS Feed
- Permalink
- Report Inappropriate Content
Mark - thank you for the extension 'Bar Plus'.
Question regarding conditional coloring in measure attribute - If you have a bar graph with two measures and you want to conditionally color them with an if statement, how would you?
I look at the sample Barsplus qvf, however, it only colors based on the measure.
Example below of Barsplus qvf:
Measure: measure 1
Measure Attribute: red()
Example of desired coloring:
Measure: measure 1
Measure Atttribute: if (dimension = "Product 1", red(),
if(dimension = "Product 2", green()))
Are you able to perform this desired color coding in Barsplus?
- Mark as New
- Bookmark
- Subscribe
- Mute
- Subscribe to RSS Feed
- Permalink
- Report Inappropriate Content
Hi Mark,
Good question Kathryn.
Can you color code the bars plus with an If expression??
- Mark as New
- Bookmark
- Subscribe
- Mute
- Subscribe to RSS Feed
- Permalink
- Report Inappropriate Content
We are looking at going into the extension mentioned below for this omarbensalem have you used this bars plus?
- Mark as New
- Bookmark
- Subscribe
- Mute
- Subscribe to RSS Feed
- Permalink
- Report Inappropriate Content
you can always use the qlik's bar; and as you can color the master measures; you can color the master dimension.
exp:
create ur master dimension, then open it:

and color it as you wish:
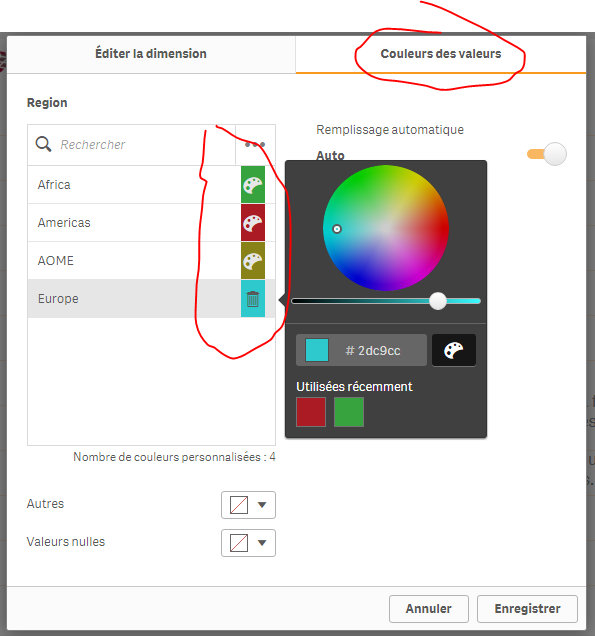
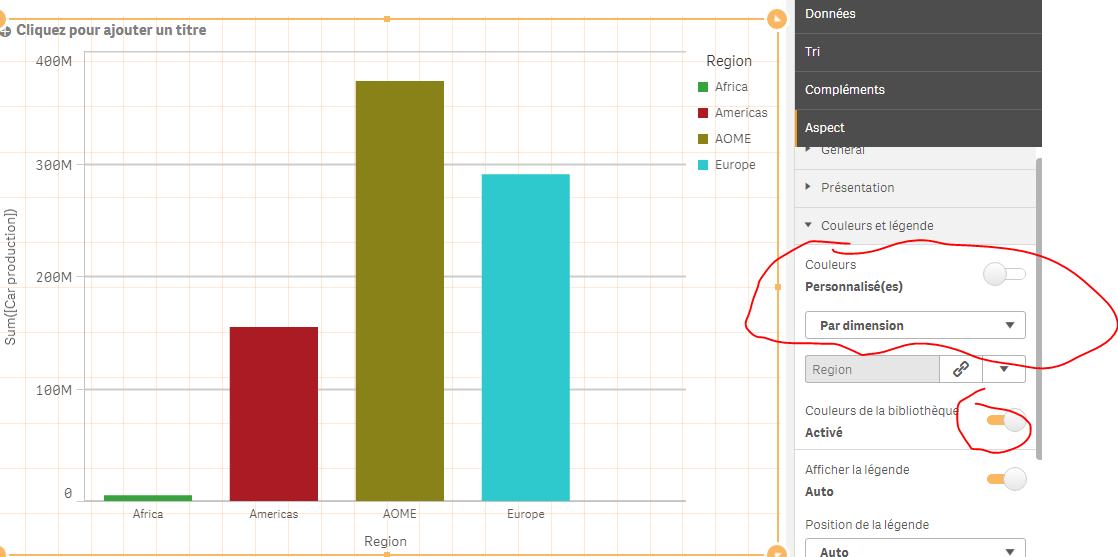
Use your master dimension as a dmension of ur graph and color it by dimension:
- Mark as New
- Bookmark
- Subscribe
- Mute
- Subscribe to RSS Feed
- Permalink
- Report Inappropriate Content
*Bump*
Very elegant solution compared to custom expression!