Unlock a world of possibilities! Login now and discover the exclusive benefits awaiting you.
- Qlik Community
- :
- All Forums
- :
- QlikView App Dev
- :
- Heat map in Qlikview
- Subscribe to RSS Feed
- Mark Topic as New
- Mark Topic as Read
- Float this Topic for Current User
- Bookmark
- Subscribe
- Mute
- Printer Friendly Page
- Mark as New
- Bookmark
- Subscribe
- Mute
- Subscribe to RSS Feed
- Permalink
- Report Inappropriate Content
Heat map in Qlikview
Hi, I did a floor plan heat map dashboard using Excel something like below which the shapes contain conditional formatting. Is there any possible way to create it in Qlikview or link it into Qlikview?
Accepted Solutions
- Mark as New
- Bookmark
- Subscribe
- Mute
- Subscribe to RSS Feed
- Permalink
- Report Inappropriate Content
Alright. So I've figured out how to do the heat map for floor plan by other way.
For KPI, I used the button to set variables to vKPI, which I get the idea from the link below.
https://www.quickintelligence.co.uk/qlikview-buttons/
And for the shapes, I replaced them using text boxes, and conditional formatting the background color.
Hope that helps.
- Mark as New
- Bookmark
- Subscribe
- Mute
- Subscribe to RSS Feed
- Permalink
- Report Inappropriate Content
When you talk about "Conditional Formatting" - Does this dynamic depends on Filter from Drop down? Will you give better clear on this?
- Mark as New
- Bookmark
- Subscribe
- Mute
- Subscribe to RSS Feed
- Permalink
- Report Inappropriate Content
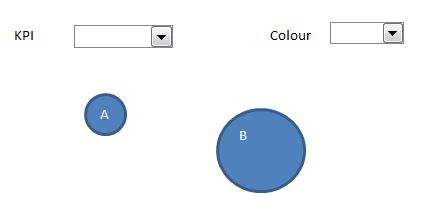
Yes. The size and color of the shapes depend on filter from drop down, and the range is the percentile of the data (drop down list from KPI). For example, if A falls between percentile 0 and 10, it will be size 1 and color code depends on the drop down.
| Percentile | Size | Color code |
| 0 | 1 | rgb |
| 10 | 2 | rgb |
| 20 | 3 | rgb |
| 30 | 4 | rgb |
| 40 | 5 | rgb |
| 50 | 6 | rgb |
| 60 | 7 | rgb |
| 70 | 8 | rgb |
| 80 | 9 | rgb |
| 90 | 10 | rgb |
Now i can only think of is conditional formatting a text box. Not sure if I'm able to change the size, but let's start with color. Does macro in Qlikview can work as Excel?
- Mark as New
- Bookmark
- Subscribe
- Mute
- Subscribe to RSS Feed
- Permalink
- Report Inappropriate Content
May be read this? Colours | Qlik Community
PFA
- Mark as New
- Bookmark
- Subscribe
- Mute
- Subscribe to RSS Feed
- Permalink
- Report Inappropriate Content
Have you got your issue? If so, Please close this thread
- Mark as New
- Bookmark
- Subscribe
- Mute
- Subscribe to RSS Feed
- Permalink
- Report Inappropriate Content
Not really what I need, but I found a way to do it.
Thanks for your reply anyway 
- Mark as New
- Bookmark
- Subscribe
- Mute
- Subscribe to RSS Feed
- Permalink
- Report Inappropriate Content
That is okay, but you have to close this thread by flag correct answer. So, you have to post what you have done with this issue and mark your response as correct and others helpful. Then next land users can understand on there environment..
Thanks
- Mark as New
- Bookmark
- Subscribe
- Mute
- Subscribe to RSS Feed
- Permalink
- Report Inappropriate Content
Alright. So I've figured out how to do the heat map for floor plan by other way.
For KPI, I used the button to set variables to vKPI, which I get the idea from the link below.
https://www.quickintelligence.co.uk/qlikview-buttons/
And for the shapes, I replaced them using text boxes, and conditional formatting the background color.
Hope that helps.