Unlock a world of possibilities! Login now and discover the exclusive benefits awaiting you.
- Qlik Community
- :
- Forums
- :
- Analytics
- :
- New to Qlik Analytics
- :
- Data load editor problems-Adding new rows from ano...
- Subscribe to RSS Feed
- Mark Topic as New
- Mark Topic as Read
- Float this Topic for Current User
- Bookmark
- Subscribe
- Mute
- Printer Friendly Page
- Mark as New
- Bookmark
- Subscribe
- Mute
- Subscribe to RSS Feed
- Permalink
- Report Inappropriate Content
Data load editor problems-Adding new rows from another table
Hi dear all, I have some problems when I am using data load editor.
I have a Table A, which have several columns, here are some fields:
Table A
Response_No, Client, Event, Q1,Q2,Q3,Q4,Q5
1, city council, training, 1,2,3,2,3
2, city council, training, 2,3,4,5,1
3, city council, training, 2,3,4,2,1
Another table is Table B, fields are :
Client, Event, Engagement,No of respondent,
For table B, it has some historical data inside, now I want to add rows into table B, the source of data come from table A,
For example, according to the data we have in table A right now, the new row in table B will be :
Client, Event, Engagement, No of respondent
city council, training, Avg(Avg(Q1) to Ave (Q5)), Count (Response_No) Group by Client,
Table A is updated weekly, so every time when we update the table A, similar rows will be added into table B. I am not sure how to achieve this in Qlik sense cloud or whether this function can be achieved, does anyone have some ideas??
- Tags:
- data load editor
- Mark as New
- Bookmark
- Subscribe
- Mute
- Subscribe to RSS Feed
- Permalink
- Report Inappropriate Content
Hi,
You may need to group by Client and Event. Not sure I understood the averages for Engagement but maybe this is what you're asking. Please check and let me know,
I hope it helps,
TableA:
Load * inline [
Response_No, Client, Event, Q1,Q2,Q3,Q4,Q5
1, city council, training, 1,2,3,2,3
2, city council, training, 2,3,4,5,1
3, city council, training, 2,3,4,2,1];
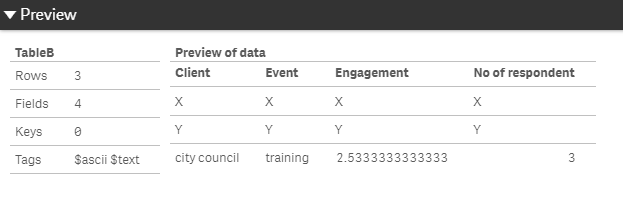
TableB:
Load * inline [
Client, Event, Engagement, No of respondent
X,X,X,X
Y,Y,Y,Y];
Load Client,
Event,
RangeAvg(Avg(Q1),Avg(Q2),Avg(Q3),Avg(Q4),Avg(Q5)) as Engagement,
Count(Response_No) as [No of respondent]
Resident TableA
Group by Client,Event;
Drop Table TableA;