Unlock a world of possibilities! Login now and discover the exclusive benefits awaiting you.
- Qlik Community
- :
- All Forums
- :
- QlikView App Dev
- :
- Pivot table issue with Aggr
- Subscribe to RSS Feed
- Mark Topic as New
- Mark Topic as Read
- Float this Topic for Current User
- Bookmark
- Subscribe
- Mute
- Printer Friendly Page
- Mark as New
- Bookmark
- Subscribe
- Mute
- Subscribe to RSS Feed
- Permalink
- Report Inappropriate Content
Pivot table issue with Aggr
Hi,
The data set looks like this
| Customer | Sales Date |
|---|---|
| Cust1 | 01/12/2017 |
| Cust1 | 12/12/2016 |
| Cust2 | 03/14/2017 |
| Cust2 | 02/15/2017 |
| Cust3 | 05/12/2017 |
| Cust3 | 06/12/2017 |
| cust4 | 05/11/2017 |
I need to build a line chart where the X axis is Month and Y axis is the count of customers whose first sales date falls in that month.
First sales date of
Cust1 is 12/12/2016
Cust2 is 02/15/2017
Cust3 is 05/12/2017
Cust4 is 05/11/2017
There is an Year filter to make sure that we can see data for one year at a time.
The dimension used is
=aggr(Month(Min({<Year=>}[Sales Date])), Customer)
and the expression used is
count(Distinct Customer)
What it results into something like (Pivot table of the line chart is shown here) when year 2017 is selected in the Year filter.
| Month | Count |
|---|---|
| Feb | 1 |
| May | 2 |
| Dec | 1 |
Now the problem is the Dec.
This should not show up becasue the year is 2017 but it shows up anyway because we are ignoring the selection of Year in the dimension expression.
And if I do not ignore the Year selection in the dimension then the chart would like something like this
| Month | Count |
|---|---|
| Jan | 1 |
| Feb | 1 |
| May | 2 |
The Jan will show up with 1 count. This happens becasue data is filtered by 2017 and Cust1 has first sales date in jan in 2017.
So i am not getting how to get to something like this.
When 2017 is selected
| Month | Count |
|---|---|
| Feb | 1 |
| May | 2 |
and when 2016 is selected
| Month | Count |
|---|---|
| Dec | 1 |
Please help.
Thanks,
Jean
- Tags:
- aggr
- pivottable
Accepted Solutions
- Mark as New
- Bookmark
- Subscribe
- Mute
- Subscribe to RSS Feed
- Permalink
- Report Inappropriate Content
Here are couple of options for you to pursue... (I have used the sample attached by loveisfail, so thanks Anil  )
)
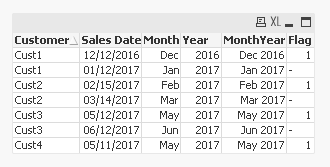
1) Create a min date flag in the script
Sample:
LOAD *,
Month([Sales Date]) as Month,
Year([Sales Date]) as Year,
MonthName([Sales Date]) as MonthYear
Inline [
Customer, Sales Date
Cust1, 01/12/2017
Cust1, 12/12/2016
Cust2, 03/14/2017
Cust2, 02/15/2017
Cust3, 05/12/2017
Cust3, 06/12/2017
Cust4, 05/11/2017
];
Left Join (Sample)
LOAD Customer,
Min([Sales Date]) as [Sales Date],
1 as Flag
Resident Sample
Group By Customer;
Flag will show up like this
Now use a chart like this...
Dimension
Month
Expression
=Count(DISTINCT {<Flag = {1}>} Customer)
2) You don't have to make any modifications in the script and use a chart like this
Dimension
Month
Expression
=Count(Aggr(If([Sales Date] = Min({<Year>}TOTAL <Customer> [Sales Date]), Customer), Customer, [Sales Date]))
When 2017 is selected
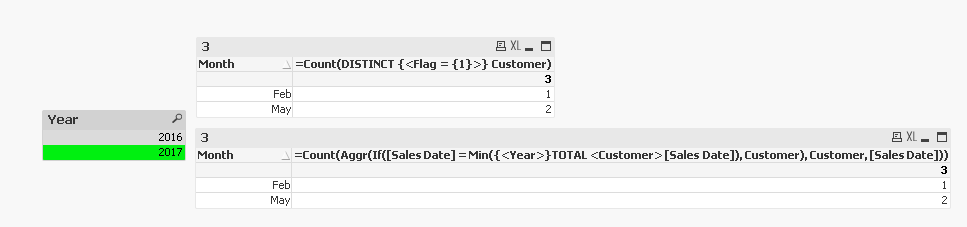
When 2016 is selected

- Mark as New
- Bookmark
- Subscribe
- Mute
- Subscribe to RSS Feed
- Permalink
- Report Inappropriate Content
PFA
- Mark as New
- Bookmark
- Subscribe
- Mute
- Subscribe to RSS Feed
- Permalink
- Report Inappropriate Content
Hi Anil,
Thanks for the reply but i do not have access to the the script so i may not be able to use this solution.
- Mark as New
- Bookmark
- Subscribe
- Mute
- Subscribe to RSS Feed
- Permalink
- Report Inappropriate Content
I think I would try it with Month or YearMonth as Dimension and:
count(aggr(firstsortedvalue(Customer, [Sales Date]), Customer, YearMonth))
as expression.
- Marcus
- Mark as New
- Bookmark
- Subscribe
- Mute
- Subscribe to RSS Feed
- Permalink
- Report Inappropriate Content
What you mean, You don't have access in script? Does it mean, You can't reload() application ??
For a while, Will you try this in expression?
Aggr(Date(Min(TOTAL <Customer> [Sales Date])), Customer)
And show us the image with Month([Sales Date]) as Dimension and expression is above.
- Mark as New
- Bookmark
- Subscribe
- Mute
- Subscribe to RSS Feed
- Permalink
- Report Inappropriate Content
Here are couple of options for you to pursue... (I have used the sample attached by loveisfail, so thanks Anil )
1) Create a min date flag in the script
Sample:
LOAD *,
Month([Sales Date]) as Month,
Year([Sales Date]) as Year,
MonthName([Sales Date]) as MonthYear
Inline [
Customer, Sales Date
Cust1, 01/12/2017
Cust1, 12/12/2016
Cust2, 03/14/2017
Cust2, 02/15/2017
Cust3, 05/12/2017
Cust3, 06/12/2017
Cust4, 05/11/2017
];
Left Join (Sample)
LOAD Customer,
Min([Sales Date]) as [Sales Date],
1 as Flag
Resident Sample
Group By Customer;
Flag will show up like this
Now use a chart like this...
Dimension
Month
Expression
=Count(DISTINCT {<Flag = {1}>} Customer)
2) You don't have to make any modifications in the script and use a chart like this
Dimension
Month
Expression
=Count(Aggr(If([Sales Date] = Min({<Year>}TOTAL <Customer> [Sales Date]), Customer), Customer, [Sales Date]))
When 2017 is selected
When 2016 is selected