Unlock a world of possibilities! Login now and discover the exclusive benefits awaiting you.
- Qlik Community
- :
- All Forums
- :
- QlikView App Dev
- :
- Using TOTAL in trending?
- Subscribe to RSS Feed
- Mark Topic as New
- Mark Topic as Read
- Float this Topic for Current User
- Bookmark
- Subscribe
- Mute
- Printer Friendly Page
- Mark as New
- Bookmark
- Subscribe
- Mute
- Subscribe to RSS Feed
- Permalink
- Report Inappropriate Content
Using TOTAL in trending?
Hi All,
I use the following expression to calculate % for any given EndDt selected (always one selected value):
Expression:
COUNT(DISTINCT Key)/COUNT(TOTAL DISTINCT Key)
If I use this for trending in a straight table (i.e. mini chart sparkline) it seems to give me the correct sparkline pattern but not the correct values - I believe this is because how total works. Can someone help explain how this is working?
COUNT({<EndDt>} DISTINCT Key)/COUNT(TOTAL {<EndDt>}DISTINCT Key)
- Mark as New
- Bookmark
- Subscribe
- Mute
- Subscribe to RSS Feed
- Permalink
- Report Inappropriate Content
The above expression works as Count the Unique number of Key and there TOTAL validity. So, Example
Key
1
2
3
4
1
2
Count(DISTINCT Key) -- 4 Where Count(TOTAL DISTINCT Key) also 4 until unless DISTINCT not presence. 4/4 = 1
Count(TOTAL Key) always counts all even unique included like 6
Same as below one, But IT ignores the irrespective of selection for EndDt ??
Does this Helps?
- Mark as New
- Bookmark
- Subscribe
- Mute
- Subscribe to RSS Feed
- Permalink
- Report Inappropriate Content
Hi,
The Total is ignoring your dimension and in this example doing a sum and a count over all values in a table.
Dim Value sum(Value) sum(Total value) count(Distinct Value) count(Total Value)
1 100 100 600 1 3
2 200 200 600 1 3
3 300 300 600 1 3
A TOTAL{<Dim>} is aggregating the values for the Dimension 'Dim':
Dim Value sum(Value) sum(Total{<Dim>} value)
1 100 100 100
2 500 500 700
2 200 200 700
3 300 300 300
- Mark as New
- Bookmark
- Subscribe
- Mute
- Subscribe to RSS Feed
- Permalink
- Report Inappropriate Content
I misspoke above - the sparkline patterns are off but the calculations for each EndDt are correct. Here is some example data - the key is a concatenation of an ID and end date.
Key EndDt Numerator
A_201312 2013-12-31 1
A_201403 2014-03-31 1
A_201406 2014-06-30 1
A_201409 2014-09-30 1
A_201412 2014-12-31 1
A_201503 2015-03-31 1
A_201506 2015-06-30 1
A_201509 2015-09-30 1
A_201512 2015-12-31 1
A_201603 2016-03-31 1
A_201606 2016-06-30 1
A_201609 2016-09-30 1
A_201612 2016-12-31 1
A_201703 2017-03-31 1
A_201706 2014-06-30 1
B_201509 2015-09-30 0
B_201512 2015-12-31 1
B_201603 2016-03-31 1
B_201606 2016-06-30 1
B_201609 2016-09-30 1
B_201612 2016-12-31 1
B_201703 2017-03-31 1
B_201706 2017-06-30 1
The sparkline that I'm seeing is as follows:
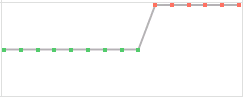
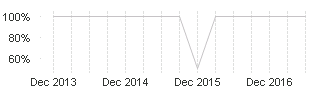
This is the trendline shape that I should be seeing:
COUNT({<EndDt>}DISTINCT Key)/COUNT(TOTAL{<EndDt>} DISTINCT Key)
Anyone have any idea why this is going on? I validated that the expression is working by computing the above expression with hardcoded EndDts in the set analysis - I get the expected values but the plot doesn't show this in the sparkline of the straight table.
Thanks!
Tina