Unlock a world of possibilities! Login now and discover the exclusive benefits awaiting you.
- Qlik Community
- :
- All Forums
- :
- QlikView App Dev
- :
- Variance in chart
- Subscribe to RSS Feed
- Mark Topic as New
- Mark Topic as Read
- Float this Topic for Current User
- Bookmark
- Subscribe
- Mute
- Printer Friendly Page
- Mark as New
- Bookmark
- Subscribe
- Mute
- Subscribe to RSS Feed
- Permalink
- Report Inappropriate Content
Variance in chart
Hi guys,
I have a table with 3 attributes,
Year, Country and Sales.
What I want to achieve is to create a Chart which shows the total sales By Each Year.
This can be achieved by Using Year as Dimension and sum(Sales) as Expression.
But my requirement is like this.
The Chart needs the following in the Dimention
Year as Bars
and Current Year vs Previous Year Variance as Line Graph
The Calculation is for example (Sales(2011) - Sales(2010))/sales (2010)
Is this Feasible in Qlikview 12. If So? How?
Accepted Solutions
- Mark as New
- Bookmark
- Subscribe
- Mute
- Subscribe to RSS Feed
- Permalink
- Report Inappropriate Content
sure
1) create Combo chart
2) Dimension = year
3) Expressions
3.1) sum(Sales) as Bar
3.2) sum(Sales) / above(sum(Sales)) as Line
at this point you have something like this
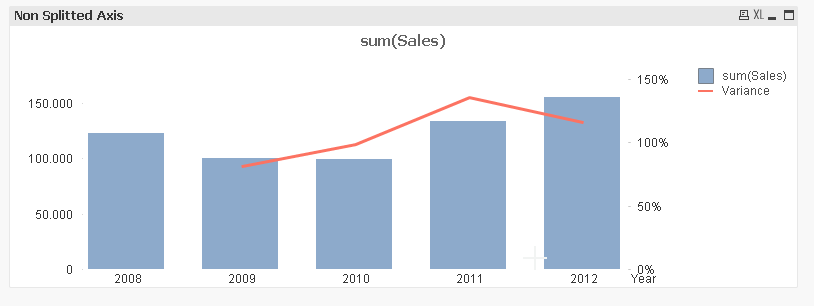
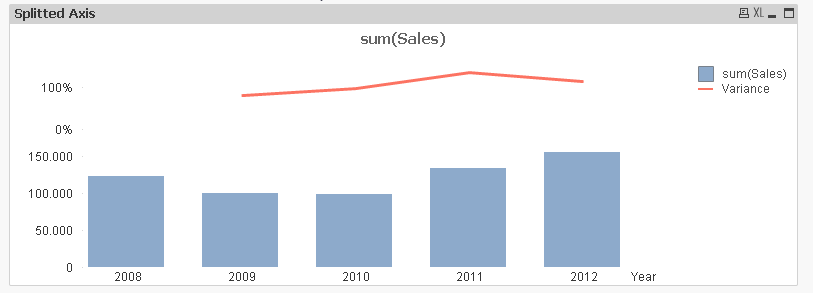
if you want to split the axes, goto axes tab

then i looks like:
- Mark as New
- Bookmark
- Subscribe
- Mute
- Subscribe to RSS Feed
- Permalink
- Report Inappropriate Content
check the qvw. This should help you.
you Need to Change the variance Expression. Its just to Show you how to get there.
regards
tim
- Mark as New
- Bookmark
- Subscribe
- Mute
- Subscribe to RSS Feed
- Permalink
- Report Inappropriate Content
Sorry Tim, I am out of the External QVW limit.
Can you post screenshots if possible
Thank You
- Mark as New
- Bookmark
- Subscribe
- Mute
- Subscribe to RSS Feed
- Permalink
- Report Inappropriate Content
sure
1) create Combo chart
2) Dimension = year
3) Expressions
3.1) sum(Sales) as Bar
3.2) sum(Sales) / above(sum(Sales)) as Line
at this point you have something like this
if you want to split the axes, goto axes tab
then i looks like:
- Mark as New
- Bookmark
- Subscribe
- Mute
- Subscribe to RSS Feed
- Permalink
- Report Inappropriate Content
Thanks Tim,
This Worked Perfectly.
Though my Requirement is bit Complicated. Just See if this is possible.
I have data in the Order
Q4 Budget Q1 Q2 Q3
Now I want the chart to display :
Budget/Q4 Q1/Budget Q2/Budget Q3/Budget.
It is even okay if these are a part of separate chart.