Unlock a world of possibilities! Login now and discover the exclusive benefits awaiting you.
- Qlik Community
- :
- Forums
- :
- Analytics
- :
- App Development
- :
- Pivot Table: Color code
Options
- Subscribe to RSS Feed
- Mark Topic as New
- Mark Topic as Read
- Float this Topic for Current User
- Bookmark
- Subscribe
- Mute
- Printer Friendly Page
Turn on suggestions
Auto-suggest helps you quickly narrow down your search results by suggesting possible matches as you type.
Showing results for
Anonymous
Not applicable
2018-01-24
04:29 PM
- Mark as New
- Bookmark
- Subscribe
- Mute
- Subscribe to RSS Feed
- Permalink
- Report Inappropriate Content
Pivot Table: Color code
Hi everyone,
I am trying to color code my pivot table. The value are ranging from -1 to 1. i try to make the data above 0 in Green and below 0 in red. And the same time, the color is also value associated.
the current expression i use is:
ColorMix2(Sum({$<country_cde={"us"}>}[pivot_data.value])/before(Sum({$<country_cde={"us"}>}[pivot_data.value]))-1,RGB(128,0,0),rgb(0,100,0))
but the color is showed is below: 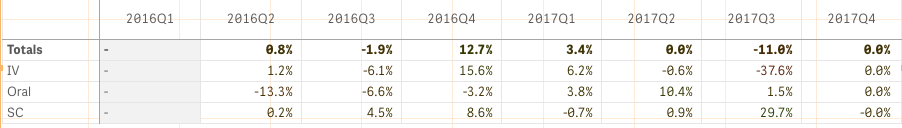
any suggestion?'
Thanks,
Nathan
400 Views
2 Replies
Partner - Champion III
2018-01-24
04:34 PM
- Mark as New
- Bookmark
- Subscribe
- Mute
- Subscribe to RSS Feed
- Permalink
- Report Inappropriate Content
Do you have a sample app or sample data we could tweak - so you get some suggestions quicker?
314 Views
Anonymous
Not applicable
2018-01-24
04:36 PM
Author
- Mark as New
- Bookmark
- Subscribe
- Mute
- Subscribe to RSS Feed
- Permalink
- Report Inappropriate Content
 ... no .. and i could not share the original data. sorry about that.
314 Views
Community Browser