Unlock a world of possibilities! Login now and discover the exclusive benefits awaiting you.
- Qlik Community
- :
- Forums
- :
- Analytics
- :
- App Development
- :
- Table Creation Help
- Subscribe to RSS Feed
- Mark Topic as New
- Mark Topic as Read
- Float this Topic for Current User
- Bookmark
- Subscribe
- Mute
- Printer Friendly Page
- Mark as New
- Bookmark
- Subscribe
- Mute
- Subscribe to RSS Feed
- Permalink
- Report Inappropriate Content
Table Creation Help
Hi All,
I'm trying to create a table in Qlik Sense to show the number of patients each month and how their appointment was booked as below:
| Source | Feb 2018 | March 2018 |
|---|---|---|
| Phone | ||
| Web Form |
I created the Month columns as measures. Below is the formula for Feb 2018 which counts the total number of appointments and filters those that were booked in Feb.
Count(
{<[Submission date.autoCalendar.YearMonth]={"2018-Feb"}>}
[Submission date])
How do I also filter it by each source?
Thanks,
- « Previous Replies
- Next Replies »
Accepted Solutions
- Mark as New
- Bookmark
- Subscribe
- Mute
- Subscribe to RSS Feed
- Permalink
- Report Inappropriate Content
Usually best performace is filtering using set analysis in expression:
Count(
{<[Submission date.autoCalendar.YearMonth]={"2018-Feb"}, Source={'email'}>}
[Submission date])
- Mark as New
- Bookmark
- Subscribe
- Mute
- Subscribe to RSS Feed
- Permalink
- Report Inappropriate Content
Hi Rick, if you add Source as dimension, each row will count the associated source values. Is not working like that?
- Mark as New
- Bookmark
- Subscribe
- Mute
- Subscribe to RSS Feed
- Permalink
- Report Inappropriate Content
You can try with Pivot table.
Row - Source
Column - [Submission date.autoCalendar.YearMonth]
Measure - count ([Submission Date])
- Mark as New
- Bookmark
- Subscribe
- Mute
- Subscribe to RSS Feed
- Permalink
- Report Inappropriate Content
Hi Ruben,
It just returns the total number of patients for that month in each field rather than filtering them by source i.e.:
| Source | Feb 2018 | March 2018 |
|---|---|---|
| Web Form | 20 | |
| Phone | 20 | |
| 20 |
- Mark as New
- Bookmark
- Subscribe
- Mute
- Subscribe to RSS Feed
- Permalink
- Report Inappropriate Content
This is usually related with data relationships... Is each record associated with only one date and source? Maybe source is not related with dates, so each one exists in all dates (or none)
You can create a simple table with source, date and recordId to check.
- Mark as New
- Bookmark
- Subscribe
- Mute
- Subscribe to RSS Feed
- Permalink
- Report Inappropriate Content
Thanks for the help here guys, I think that is the issue, the data source with the sources column isn't linked to the other sources for bookings/appointments. I'll have a go at getting this sorted and retest and see if it works.
Thanks again for your help on this.
- Mark as New
- Bookmark
- Subscribe
- Mute
- Subscribe to RSS Feed
- Permalink
- Report Inappropriate Content
Just a quick one in relation to this. How do I create a column and only display certain values? (without applying a filter)
I.e. If I want to only show fields where the course is Email?
So when I'm creating a row, in the field I'm putting Source = "email"
- Mark as New
- Bookmark
- Subscribe
- Mute
- Subscribe to RSS Feed
- Permalink
- Report Inappropriate Content
Usually best performace is filtering using set analysis in expression:
Count(
{<[Submission date.autoCalendar.YearMonth]={"2018-Feb"}, Source={'email'}>}
[Submission date])
- Mark as New
- Bookmark
- Subscribe
- Mute
- Subscribe to RSS Feed
- Permalink
- Report Inappropriate Content
Thanks again for the help on this, all looking good so far! 
One more thing I need abit of advice on:
We have the need to store all of our KPI's in the same table so that we can export them all together rather than having to click on every individual table and export to excel.
This is what we need:
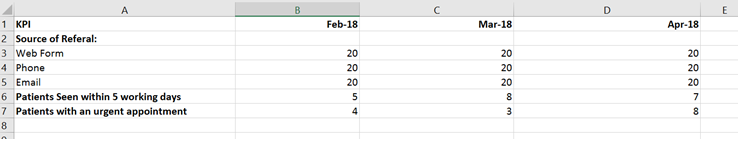
Currently these are created separately i.e. Table 1: Source of Referal, Table 2: Patients seen within 5 working days.
Is it possible to combine these into the same pivot table?
Failing this; is there a way to export multiple tables on the same sheet as an excel/csv file at the same time?
- Mark as New
- Bookmark
- Subscribe
- Mute
- Subscribe to RSS Feed
- Permalink
- Report Inappropriate Content
Hi Ric, to export many tables at once I think you need a macro.
To use in the same table maybe a quick fix can be done:
// Add an inline table with KPIs
KPI:
LOAD * Inline [
IdKPI, KPI
1, Source of referal
2, ...
3, ...
];
In table add dimension KPI and a calculated dimension like:
If(IdKPI=1, Source)
The expression can use the idKPI to select the expression:
Pick(IdKPI
, Expression for kpi1
, Expression for kpi2
, Expression for kpi3
)
Maybe needs aggr(:
Aggr(Pick(
...
), IdKPI)
- « Previous Replies
- Next Replies »