Unlock a world of possibilities! Login now and discover the exclusive benefits awaiting you.
- Qlik Community
- :
- Forums
- :
- Analytics
- :
- New to Qlik Analytics
- :
- Creating an aggregated dimension filter : Urgent r...
- Subscribe to RSS Feed
- Mark Topic as New
- Mark Topic as Read
- Float this Topic for Current User
- Bookmark
- Subscribe
- Mute
- Printer Friendly Page
- Mark as New
- Bookmark
- Subscribe
- Mute
- Subscribe to RSS Feed
- Permalink
- Report Inappropriate Content
Creating an aggregated dimension filter : Urgent requirement
Hi,
This is an urgent requirement. I've the data in the below format and it has data for 10 different brands in the similar manner as given below. I need to create an aggregated dimension out of this which would in turn be used as a filter. The requirement is to create 'Top 3 Brands', 'Top 5 Brands', 'Top 7 Brands','Top 10 Brands' drop downs from the available data basis sales. So the aggregated dimension should act as a filter with the mentioned drop downs.
| Brands | Year | Sales |
| a | 2017 | 500 |
| a | 2017 | 400 |
| b | 2017 | 450 |
| b | 2017 | 399 |
| b | 2016 | 560 |
| c | 2016 | 457 |
| c | 2017 | 1231 |
| c | 2017 | 323 |
- Mark as New
- Bookmark
- Subscribe
- Mute
- Subscribe to RSS Feed
- Permalink
- Report Inappropriate Content
Hi vishal,
Sample Script:
fact:
load * Inline [
Brands,Year,Sales
a,2017,500
a,2017,400
b,2017,450
b,2017,399
b,2016,560
c,2016,457
c,2017,1231
c,2017,323
];
TopDim:
load * Inline [
TopN,N
Top1,1
Top2,2
Top3,3
];
Dimension:
Brands
Year
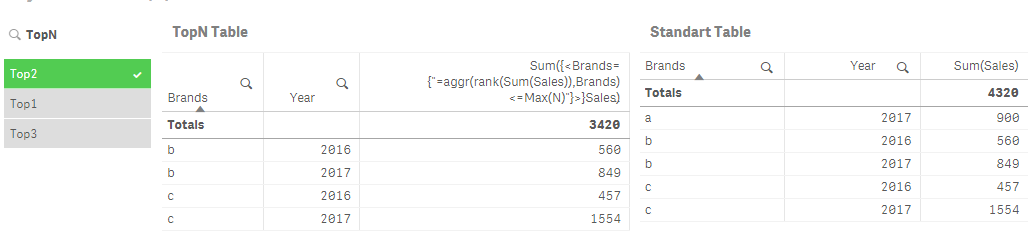
Measure:
Sum({<Brands={"=aggr(rank(Sum(Sales)),Brands)<=Max(N)"}>}Sales)
- Mark as New
- Bookmark
- Subscribe
- Mute
- Subscribe to RSS Feed
- Permalink
- Report Inappropriate Content
Hi Kaan,
Thanks for your help on this. I however want the created filter to act as a Global filter just like normal filters, on all the visualizations across all views. With this i'l be able to apply it on only selected tables/visualizations,
- Mark as New
- Bookmark
- Subscribe
- Mute
- Subscribe to RSS Feed
- Permalink
- Report Inappropriate Content
Hi,
may be create a column with the rank, and make it used for search,
and the search acts as a filter if you type : <=2 or <=3 and so on
regards
- Mark as New
- Bookmark
- Subscribe
- Mute
- Subscribe to RSS Feed
- Permalink
- Report Inappropriate Content
I have created this Dimension :
If((Aggr(Rank(Sum(${<YEAR = {$(=Max(YEAR))}>}Sales)),BRAND)) < 6, 'Top 05',
If((Aggr(Rank(Sum({$<YEAR = {$(=Max(YEAR))}>}Sales)),BRAND)) > 11, 'Top 10',
If((Aggr(Rank(Sum({$<YEAR = {$(=Max(YEAR))}>}Sales)),BRAND)) > 16 , 'Top 15')))
But this gives results as Top 5, Top 5-10, Top 10-15. I know I'm close to the solution, just not getting the required thing.
- Mark as New
- Bookmark
- Subscribe
- Mute
- Subscribe to RSS Feed
- Permalink
- Report Inappropriate Content
Try this
In dim just : if(aggr(rank(-sum...... <=N, top)
In your script load table in-line field top, N
With top5, 5
Top10,10
Top15,15
I think you must have to click more in the sheet to select as filter