Unlock a world of possibilities! Login now and discover the exclusive benefits awaiting you.
- Qlik Community
- :
- Forums
- :
- Analytics
- :
- New to Qlik Analytics
- :
- Color by alternative dimension in QS
- Subscribe to RSS Feed
- Mark Topic as New
- Mark Topic as Read
- Float this Topic for Current User
- Bookmark
- Subscribe
- Mute
- Printer Friendly Page
- Mark as New
- Bookmark
- Subscribe
- Mute
- Subscribe to RSS Feed
- Permalink
- Report Inappropriate Content
Color by alternative dimension in QS
Dear all,
Please help to check the case we faced.
We have a Line chart that has 2 dimensions and 2 or more Alternative Dimensions and One Measure.
Then We put colour by dimension and we specify one dimension that is in your Chart.
For example, we have 2 dimensions A and B, and we have 2 alternative dimensions C and D, then we want to set color by dimension, then we put color by dimension A, but once we selected C / D as dimensions, Legend is always showing values for A what we set. We dont find any solution to set color by alternative dimension.
So my question is that we changed the alternative dimensions, the color legend still display the dimension specify in the color by dimension. Is it possible to color by alternative dimensions? Thanks.
Best Regards,
Haifeng
- Mark as New
- Bookmark
- Subscribe
- Mute
- Subscribe to RSS Feed
- Permalink
- Report Inappropriate Content
Instead of using alternative dimension; I would suggest creating an island table using the inline load.
Let me explain; let's assume u only have have 2 dimensions; one shown and one alternative; and each time you want to color by the present dimension.
This is how this can be altered:
1) in the script, create an inline table as follow:
load * inline [
DimID, Dim
1, Dim1
2, Dim2
];
2) add this new created Dim field as a filter in ur dashboard.
3) Now in ur chart,
as dimension:
if (DimID=1, YourDimensionA, YourDimensionB)
and color by dimension
Thtis way, every time you make a selection in the dimension you want to show; it would be colored by the selected dimension.
Hope that was clear
- Mark as New
- Bookmark
- Subscribe
- Mute
- Subscribe to RSS Feed
- Permalink
- Report Inappropriate Content
Hi Haifeng,
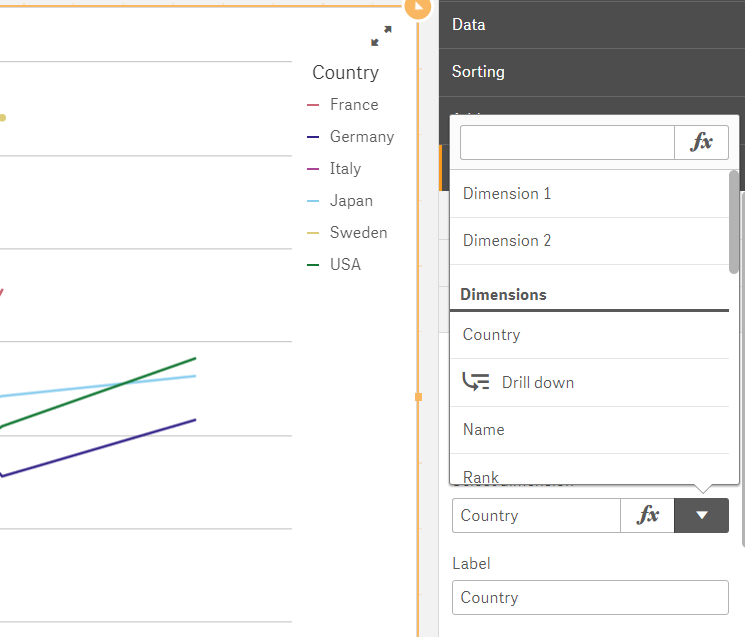
If you use the April release (potentially February, I can't test right now) you will have the option of coloring by "relative dimension". Meaning if you pick color by Dimension 1 or 2 in this screenshot then it will always color by that what dimension is used in that position in the chart when the user switches among the alternative ones.
Dimension 1 = Year (X-Axis)
Dimension 2 = Country
Best regards,
Patrik.