Unlock a world of possibilities! Login now and discover the exclusive benefits awaiting you.
- Qlik Community
- :
- Forums
- :
- Analytics
- :
- App Development
- :
- Calculated dimension label in Selections Bar
- Subscribe to RSS Feed
- Mark Topic as New
- Mark Topic as Read
- Float this Topic for Current User
- Bookmark
- Subscribe
- Mute
- Printer Friendly Page
- Mark as New
- Bookmark
- Subscribe
- Mute
- Subscribe to RSS Feed
- Permalink
- Report Inappropriate Content
Calculated dimension label in Selections Bar
Hello,
I'm using a calculated dimension for one of my charts in a mashup, but when a selection is made by clicking directly on the lines, the resulting tag in the selections bar shows the dimension formula instead of the actual dimension. For the screenshot below, the dimensions is:
=If([Growth MonthYear] < $(vCurrencyMostRecentSale), [Growth MonthYear Label])
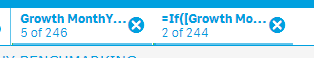
Where Growth MonthYear Label is simply a text representation of the date Growth MonthYear. As you can see, there are already a few [Growth MonthYear Label] values filtered. I'd expect when a selection is made through the chart, the filtered [Growth MonthYear Label] values should change instead of having a new dimension value appear.
According to this post Calculated dimensions in selection bar:Qlik Sense, this issue was fixed in Qlik Sense 3.2. In my case I'm running the February 2018 Patch 1 version and the problem persists (both in Server and Desktop versions).
I've tried using Master Items, visualizations created on the fly, master dimensions and "regular" dimensions. Note that the problem is the same in the application and in the mashup.
The only way I've managed to get the desired result is by using a regular dimension, adding a conditional statement to my measure, and unchecking the checkbox in Add-ons > Data handling > Include zero values. This option, however, is not available for Filter pane objects (obviously) or for chart visualizations created on the fly, which is what I need.
Is this a bug? Any help would be appreciated.
- Mark as New
- Bookmark
- Subscribe
- Mute
- Subscribe to RSS Feed
- Permalink
- Report Inappropriate Content
Hi,
Did you find any solution for this scenario, even i am facing this issue.
Please let me know if you have any solution.
Thanks,
- Mark as New
- Bookmark
- Subscribe
- Mute
- Subscribe to RSS Feed
- Permalink
- Report Inappropriate Content
Hey, did you find any solution to this?