Unlock a world of possibilities! Login now and discover the exclusive benefits awaiting you.
- Qlik Community
- :
- Forums
- :
- Analytics
- :
- New to Qlik Analytics
- :
- 100% Stacked Bar Chart
Options
- Subscribe to RSS Feed
- Mark Topic as New
- Mark Topic as Read
- Float this Topic for Current User
- Bookmark
- Subscribe
- Mute
- Printer Friendly Page
Turn on suggestions
Auto-suggest helps you quickly narrow down your search results by suggesting possible matches as you type.
Showing results for
Contributor III
2018-06-11
02:59 PM
- Mark as New
- Bookmark
- Subscribe
- Mute
- Subscribe to RSS Feed
- Permalink
- Report Inappropriate Content
100% Stacked Bar Chart
Hi,
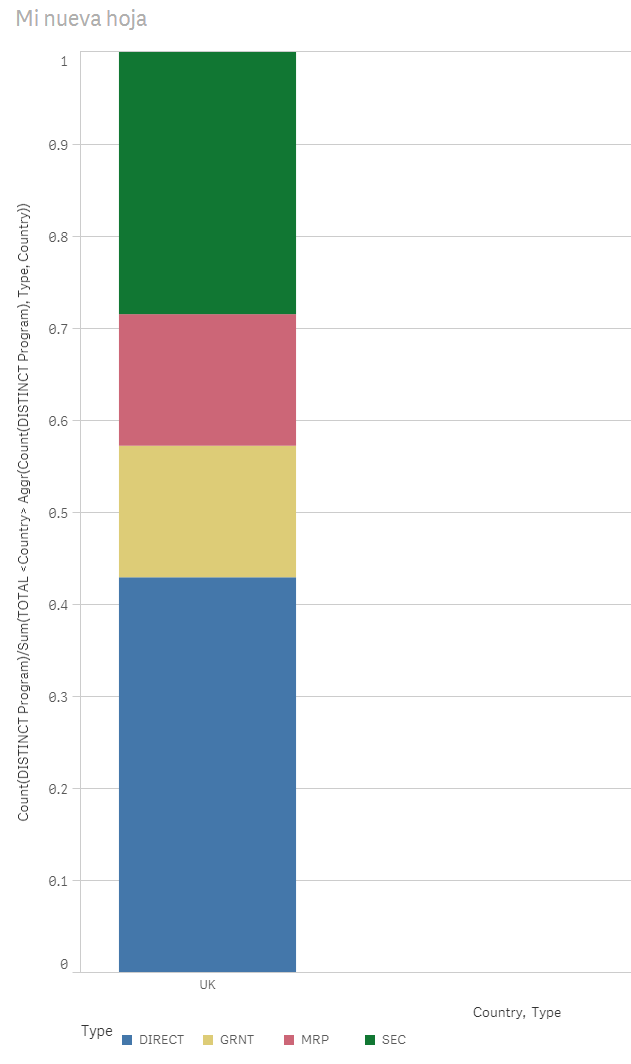
I need to build an Stacked Bar Chart where all bars sum 100%.
One dimention is Country and the other one is Type and the expresion its a count of Program.
The problem is with the denominator for the percentage because a program can be repeated for the same country and type since it can have different products
I tried with
COUNT (TOTAL <Country> Program)
AGGR(nodistinct COUNT(Program), Country)
| Program | Type | Country | Product |
| P1 | DIRECT | UK | PTE |
| P1 | DIRECT | UK | KMG |
| P2 | DIRECT | UK | ASD |
| P2 | DIRECT | UK | PYU |
| P2 | DIRECT | UK | KMG |
| P2 | SEC | UK | PTE |
| P3 | GRNT | UK | PYU |
| P3 | GRNT | UK | ASD |
| P3 | GRNT | UK | KMG |
| P3 | DIRECT | UK | KMG |
| P3 | MRP | UK | PTE |
| P3 | MRP | UK | KMG |
| P3 | SEC | UK | PYU |
I attached the qvf and the excel with the graph that should be shown.
Thanks in advanced.
404 Views
1 Reply
MVP
2018-06-11
03:14 PM
- Mark as New
- Bookmark
- Subscribe
- Mute
- Subscribe to RSS Feed
- Permalink
- Report Inappropriate Content
Try this
Count(DISTINCT Program)/Sum(TOTAL <Country> Aggr(Count(DISTINCT Program), Type, Country))
362 Views
Community Browser