Unlock a world of possibilities! Login now and discover the exclusive benefits awaiting you.
- Qlik Community
- :
- Forums
- :
- Analytics
- :
- New to Qlik Analytics
- :
- How to visualize following requirement in Qlik Sen...
- Subscribe to RSS Feed
- Mark Topic as New
- Mark Topic as Read
- Float this Topic for Current User
- Bookmark
- Subscribe
- Mute
- Printer Friendly Page
- Mark as New
- Bookmark
- Subscribe
- Mute
- Subscribe to RSS Feed
- Permalink
- Report Inappropriate Content
How to visualize following requirement in Qlik Sense?
Hi
There are 4 columns data in table
1. NodeName
2. DateandTimeStart
3. DateandTimeEnd
4. Attemtps
5. Success
I want to display only the Nodename along with DateandTimestart & DateandTimeEnd when Success>Attemtps.
This DateandtimeStart/End will be of 15 min duration for every day means.. there are 96 rows for a day for every NodeNames in Network with random values Attemtps/Success
Please suggest how to visualize my condition (Success>Attemtps) and which type of charts are best to visualize these requirement?
Thanks in Advance
Regards
Suresh
- Mark as New
- Bookmark
- Subscribe
- Mute
- Subscribe to RSS Feed
- Permalink
- Report Inappropriate Content
In your load script you could create a new field that is Y or N when Success is greater than attempts.
Then in your chart you would not have to do the calculation. Just check for value of Y and display only those rows data.
Based on what you have stated it sounds like a simple table would be the best visualization. Unless you are trying to show some kind of trending.
I really would need a better description of what your Use Case is for this to give you a good answer.
- Mark as New
- Bookmark
- Subscribe
- Mute
- Subscribe to RSS Feed
- Permalink
- Report Inappropriate Content
@Hi
Thanks for revert.
I succeeded by providing following expression in Table (Charts)
Here its displaying only Bsname but i want to display two more column data also.. i.e DateandTimeStart and DateandTimeend including Bsname which is already displaying now.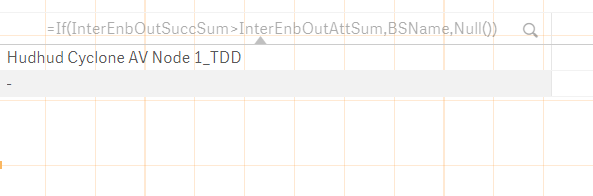
There are around 10+ Bsnames but only above Bsname is matching if condition and for the same reason its displaying only HudHud*** Name in Chart.
Similarly can you explain easy way to display data in detail as i'm unable to use if condition in Load script.
Please share sample script by using above column data.
Thanks
Suresh