Unlock a world of possibilities! Login now and discover the exclusive benefits awaiting you.
- Qlik Community
- :
- Forums
- :
- Analytics
- :
- New to Qlik Analytics
- :
- Sales for specific months only, but across years o...
- Subscribe to RSS Feed
- Mark Topic as New
- Mark Topic as Read
- Float this Topic for Current User
- Bookmark
- Subscribe
- Mute
- Printer Friendly Page
- Mark as New
- Bookmark
- Subscribe
- Mute
- Subscribe to RSS Feed
- Permalink
- Report Inappropriate Content
Sales for specific months only, but across years only
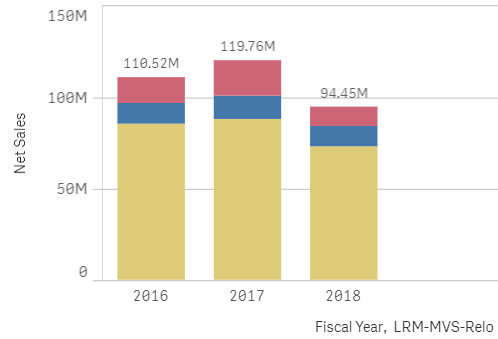
Hi, I have a bar graph that denotes the sales of some products for the years 2016-2018. However since 2018 is only in the 8th month now I want to change this graph to show the sales for 8 month for the years 2016 and 2017 as well. Can anyone help me with a code to do this? I want it across years only, but showing only up to 8 months
I have data on Quarters as well as Months to enable the same but however I'm unsure of the code for this.
Accepted Solutions
- Mark as New
- Bookmark
- Subscribe
- Mute
- Subscribe to RSS Feed
- Permalink
- Report Inappropriate Content
Then use fiscal month to calculated monthnum 
Num(Month(Date#([fiscal month], 'YYYY/MM'))) as NumMonth
- Mark as New
- Bookmark
- Subscribe
- Mute
- Subscribe to RSS Feed
- Permalink
- Report Inappropriate Content
May be do this
Sum({<NumMonth = {"<=$(=Num(Month(Today())))"}>}Sales)
Where NumMonth is created in the script
Num(Month(Date)) as NumMonth
- Mark as New
- Bookmark
- Subscribe
- Mute
- Subscribe to RSS Feed
- Permalink
- Report Inappropriate Content
I do not have a field that has date, can i use[ fiscal year] in place of this?
- Mark as New
- Bookmark
- Subscribe
- Mute
- Subscribe to RSS Feed
- Permalink
- Report Inappropriate Content
Does Fiscal Year include Month information?
- Mark as New
- Bookmark
- Subscribe
- Mute
- Subscribe to RSS Feed
- Permalink
- Report Inappropriate Content
no , Fiscal year has just 2016, 2017 and 2018
fiscal month is as follows: 2016/01 2016/02 and so on
and fiscal quarter is 2016 Q1, 2016 Q2 and so on
- Mark as New
- Bookmark
- Subscribe
- Mute
- Subscribe to RSS Feed
- Permalink
- Report Inappropriate Content
Then use fiscal month to calculated monthnum
Num(Month(Date#([fiscal month], 'YYYY/MM'))) as NumMonth
- Mark as New
- Bookmark
- Subscribe
- Mute
- Subscribe to RSS Feed
- Permalink
- Report Inappropriate Content
Thank you so much!