Unlock a world of possibilities! Login now and discover the exclusive benefits awaiting you.
- Qlik Community
- :
- All Forums
- :
- QlikView App Dev
- :
- Bar Chart: Trying to compare volume data
- Subscribe to RSS Feed
- Mark Topic as New
- Mark Topic as Read
- Float this Topic for Current User
- Bookmark
- Subscribe
- Mute
- Printer Friendly Page
- Mark as New
- Bookmark
- Subscribe
- Mute
- Subscribe to RSS Feed
- Permalink
- Report Inappropriate Content
Bar Chart: Trying to compare volume data
Hi All,
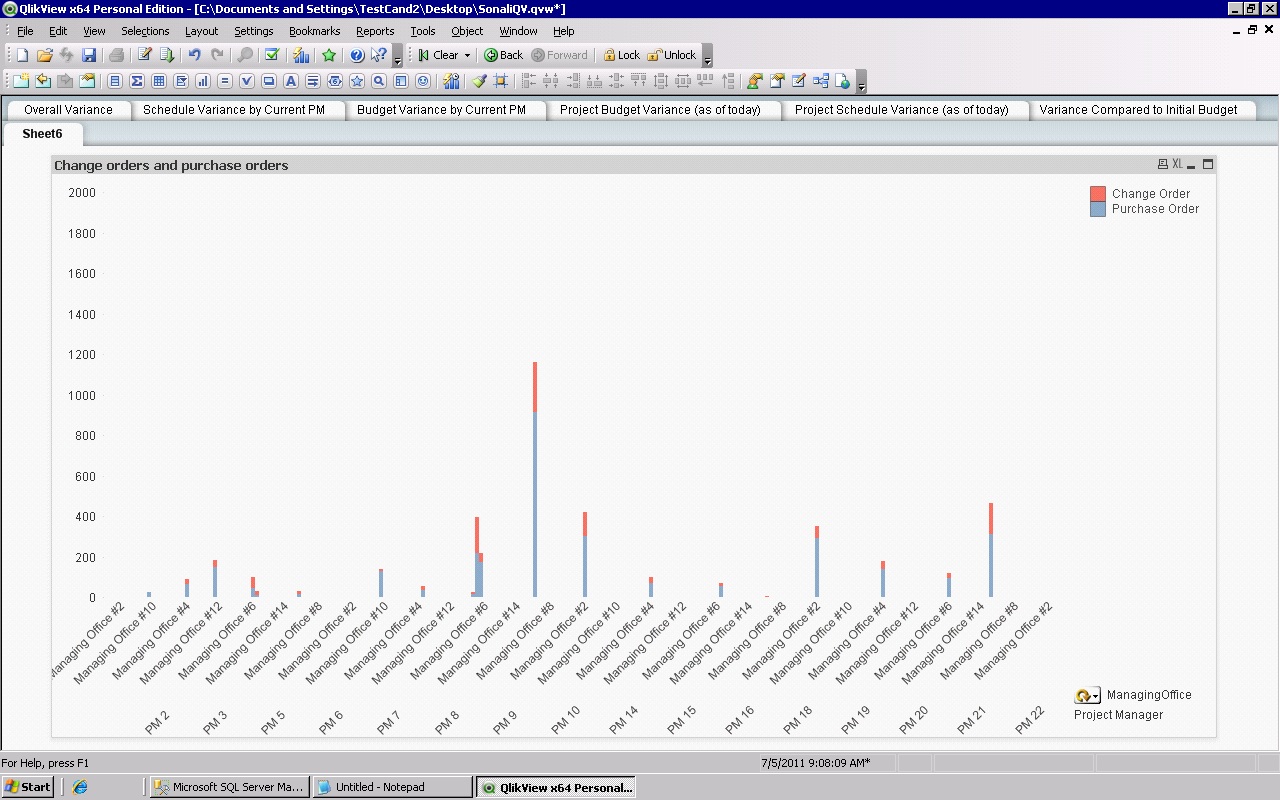
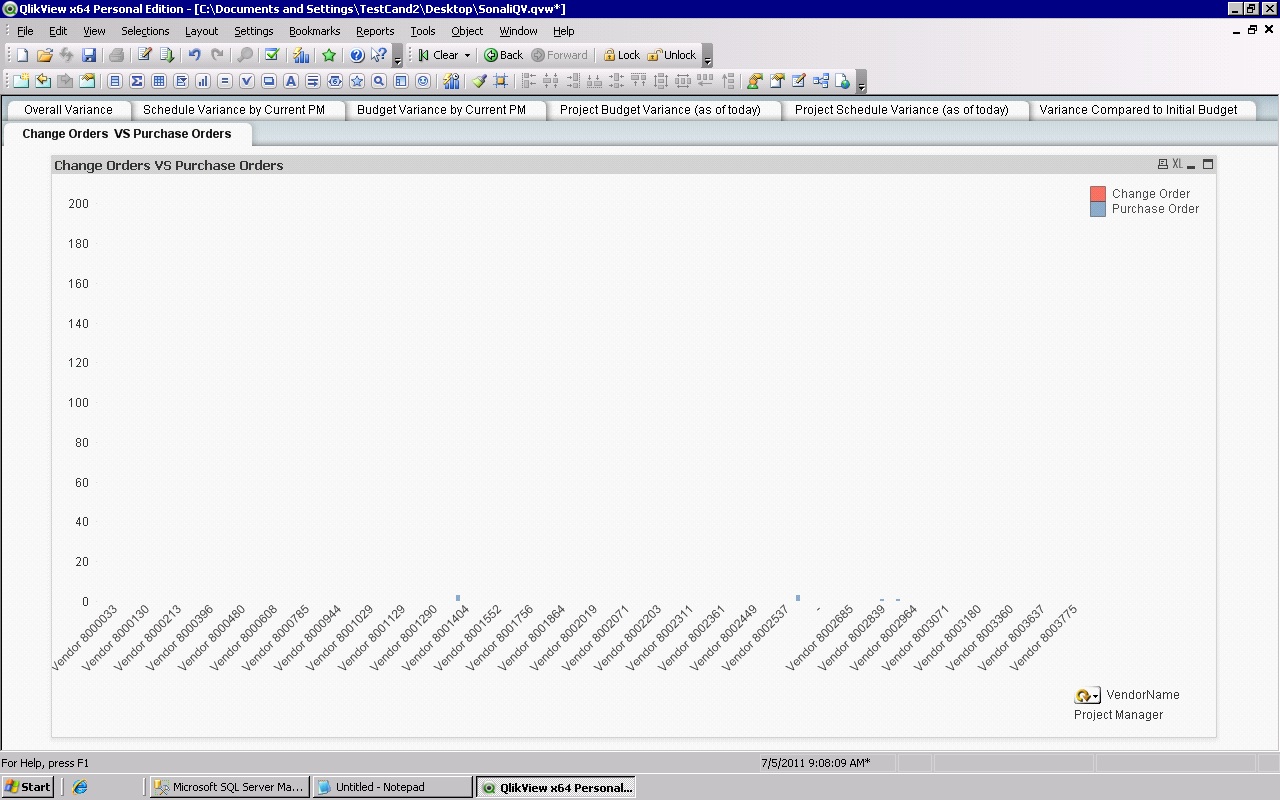
The task wants me to show the volume for change orders by project manager and the purchase orders by vendor. Is it possible to put this on the same chart? Also I have to show grouping by managing office and vendor.
I don't think the expressions I have - count(changeorder_num) and count(purchaseorder_num) does this? Plus I have to group by managing office and vendor. So far I have made project manager a dimension and the count(changeorder_num) and count(purchaseorder_num) my expressions. To show grouping by managing office and vendor I used the group feature - the cyclic one...is this correct? I've attached a screen shot of what I have so far.
I would appreciate any help as I have this task to complete as part of an interview process and I have never used QV before. Just learning as I go! Any help would be fantastic. Thank you!!
- Tags:
- new_to_qlikview
- Mark as New
- Bookmark
- Subscribe
- Mute
- Subscribe to RSS Feed
- Permalink
- Report Inappropriate Content
Hi,
Can you please send me the qvw file. with your desired output in a excel sheet.
Regards,
Kaushik Solanki

