Unlock a world of possibilities! Login now and discover the exclusive benefits awaiting you.
- Qlik Community
- :
- All Forums
- :
- QlikView App Dev
- :
- Add a reference from Year 2010 till Year 2011
Options
- Subscribe to RSS Feed
- Mark Topic as New
- Mark Topic as Read
- Float this Topic for Current User
- Bookmark
- Subscribe
- Mute
- Printer Friendly Page
Turn on suggestions
Auto-suggest helps you quickly narrow down your search results by suggesting possible matches as you type.
Showing results for
Contributor III
2011-07-21
02:33 AM
- Mark as New
- Bookmark
- Subscribe
- Mute
- Subscribe to RSS Feed
- Permalink
- Report Inappropriate Content
Add a reference from Year 2010 till Year 2011
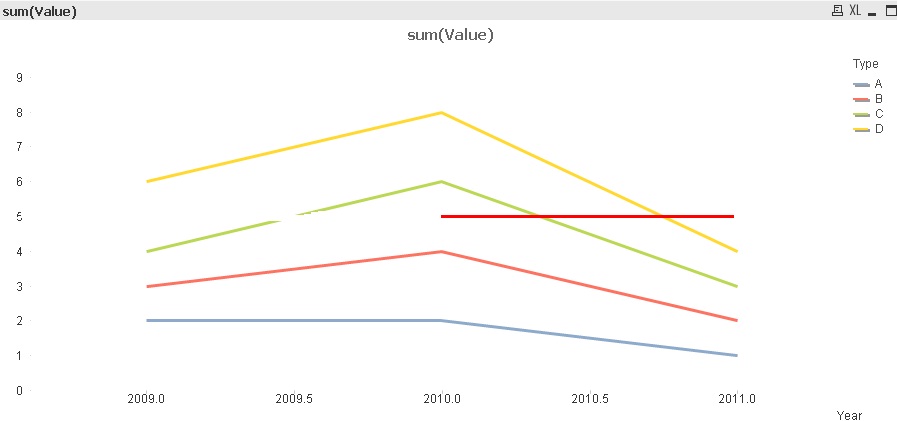
I've a chart, I would like to add a line at value 5, from year 2010 till year 2011
How can I achieve that?
- Tags:
- new_to_qlikview
715 Views
4 Replies
Partner Ambassador/MVP
2011-07-21
02:44 AM
- Mark as New
- Bookmark
- Subscribe
- Mute
- Subscribe to RSS Feed
- Permalink
- Report Inappropriate Content
HI,
Go to properties of the chart -> Presentation Tab ->
Here you will find the area to add the reference line.
Click add and use the condition to add the reference like as you want.
Regards,
Kaushik Solanki
Please remember to hit the 'Like' button and for helpful answers and resolutions, click on the 'Accept As Solution' button. Cheers!
224 Views
Contributor III
2011-07-21
02:56 AM
Author
- Mark as New
- Bookmark
- Subscribe
- Mute
- Subscribe to RSS Feed
- Permalink
- Report Inappropriate Content
Can you help me to add in the file, I've been trying but still cannot make it..
224 Views
Partner Ambassador/MVP
2011-07-21
03:04 AM
- Mark as New
- Bookmark
- Subscribe
- Mute
- Subscribe to RSS Feed
- Permalink
- Report Inappropriate Content
Hi,
Here is the example.
Regards,
Kaushik Solanki
Please remember to hit the 'Like' button and for helpful answers and resolutions, click on the 'Accept As Solution' button. Cheers!
224 Views
Contributor III
2011-07-22
03:36 AM
Author
- Mark as New
- Bookmark
- Subscribe
- Mute
- Subscribe to RSS Feed
- Permalink
- Report Inappropriate Content
Thanks for your help.
But this is not the chart which I'm after, the line which I need, draw from Year 2010 to Year 2011. Please refer
224 Views