Unlock a world of possibilities! Login now and discover the exclusive benefits awaiting you.
- Qlik Community
- :
- All Forums
- :
- QlikView App Dev
- :
- Does not calculate in IF-Statement appropriate
- Subscribe to RSS Feed
- Mark Topic as New
- Mark Topic as Read
- Float this Topic for Current User
- Bookmark
- Subscribe
- Mute
- Printer Friendly Page
- Mark as New
- Bookmark
- Subscribe
- Mute
- Subscribe to RSS Feed
- Permalink
- Report Inappropriate Content
Does not calculate in IF-Statement appropriate
Dear all,
I've created an IF-Statement in a chart:
=if([Article Group]='9999',(sum({<[Article Group]={'9999'}>}[Revenues]))+
(sum(aggr((sum({<[cpa_Main Article Group Description]={'9999'}>}[Revenues])/
sum({1<[Product]={'A0001'}>}[Revenues])*
sum({1<[Article Group]={'1111'}>}[Revenues])),[Geography],[Month],[Year])))+
(sum(aggr((sum({<[cpa_Main Article Group Description]={'9999'}>}[Revenues])/
sum({1<[Product]={'A0001'}>[Revenues])*
sum({1<[Article Group]={'2222'}>}[Revenues])*0.5),[cpa_Geo 4],[Geography],[Month],[Year]))),
sum([Revenues]))
My Dimension is Year and Article Group.
If I do not select anything it shows me a different Revenue, than selecting the ArticleGroup in the IF-Statement.
See in this case the gray one: Here it's abount 6Million
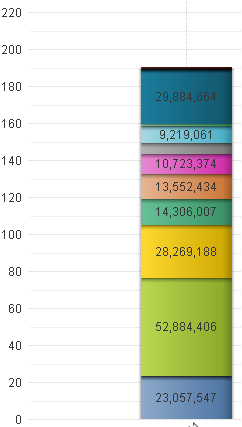
Once I select, it's about 11M - this is correct.
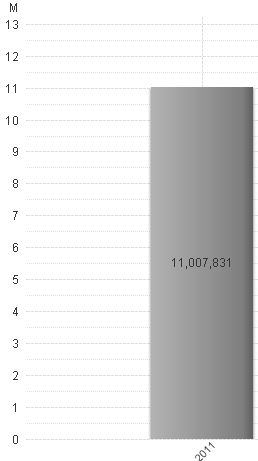
But how could I calculate the right one, even without selecting anything?
Thanks for your help.
- Mark as New
- Bookmark
- Subscribe
- Mute
- Subscribe to RSS Feed
- Permalink
- Report Inappropriate Content
Seems nobdoy has an answer?
- Mark as New
- Bookmark
- Subscribe
- Mute
- Subscribe to RSS Feed
- Permalink
- Report Inappropriate Content
I don't see an obvious answer.
Most of the time, it's much easier too find the root causing the issue, if you could post an QV application showing your problem here. If you don't want to post your data here, maybe you could build an example app or load in sample data.