Unlock a world of possibilities! Login now and discover the exclusive benefits awaiting you.
- Qlik Community
- :
- All Forums
- :
- QlikView App Dev
- :
- How to represent table in trellis style format??
- Subscribe to RSS Feed
- Mark Topic as New
- Mark Topic as Read
- Float this Topic for Current User
- Bookmark
- Subscribe
- Mute
- Printer Friendly Page
- Mark as New
- Bookmark
- Subscribe
- Mute
- Subscribe to RSS Feed
- Permalink
- Report Inappropriate Content
How to represent table in trellis style format??
Hi All,
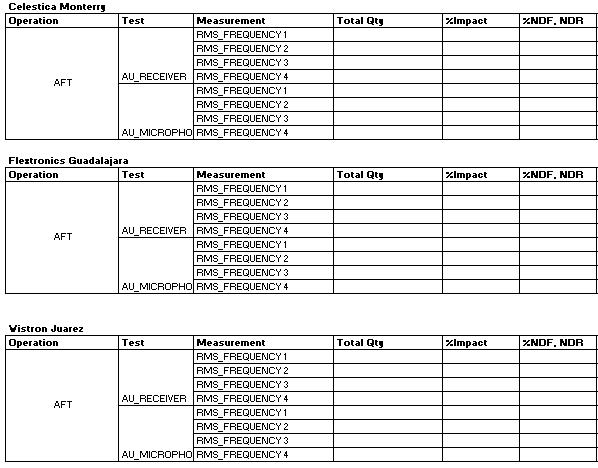
In the figure below i need to show table in this format in qlikview. tables are separated by there location. Clestica Monterry, Flextronics and wistron are the locations..
Please help me out to how would i able to show table like below format in qlikview... i am not able to find any clue..
Thanks.
- Mark as New
- Bookmark
- Subscribe
- Mute
- Subscribe to RSS Feed
- Permalink
- Report Inappropriate Content
HI Sushil,
If you want this representation, you must choose the Pivot Table chart, and then select "Location", "Operation", "Test" and "Measurement" in dimensions.
Your expressions will be the "Total Quantity", "%Impact" and "%NDF, NDR".
Regards,
Amand
- Mark as New
- Bookmark
- Subscribe
- Mute
- Subscribe to RSS Feed
- Permalink
- Report Inappropriate Content
but the main problem is with location.. which is out side of each sub table?
Thanks for your reply
- Mark as New
- Bookmark
- Subscribe
- Mute
- Subscribe to RSS Feed
- Permalink
- Report Inappropriate Content
I think you must add a new table in the data model with your locations.
Can you attach your qvw file please ?
Regards,
Amand
- Mark as New
- Bookmark
- Subscribe
- Mute
- Subscribe to RSS Feed
- Permalink
- Report Inappropriate Content
Please find the attached QVW.. i want to generate table separately for each location or selected locations
Thanks
- Mark as New
- Bookmark
- Subscribe
- Mute
- Subscribe to RSS Feed
- Permalink
- Report Inappropriate Content
Sushil,
See the attached file. I make an example with the set analysis.
Regards,
Amand
- Mark as New
- Bookmark
- Subscribe
- Mute
- Subscribe to RSS Feed
- Permalink
- Report Inappropriate Content
Hi Thanks Amand..
Is it possible to do it automaticaly... means instead of creating each table manually it will populate according to the selected location
- Mark as New
- Bookmark
- Subscribe
- Mute
- Subscribe to RSS Feed
- Permalink
- Report Inappropriate Content
Sushil,
You can do this with a macro, which can generate your charts automatically. See the API Guide in your QlikView installation directory.
Why do you want this representation ? For a report ?
Regards,
Amand