Unlock a world of possibilities! Login now and discover the exclusive benefits awaiting you.
- Qlik Community
- :
- All Forums
- :
- QlikView App Dev
- :
- Pivot table expression font color issue
- Subscribe to RSS Feed
- Mark Topic as New
- Mark Topic as Read
- Float this Topic for Current User
- Bookmark
- Subscribe
- Mute
- Printer Friendly Page
- Mark as New
- Bookmark
- Subscribe
- Mute
- Subscribe to RSS Feed
- Permalink
- Report Inappropriate Content
Pivot table expression font color issue
Hi,
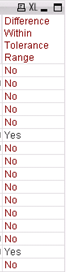
I have created a Pivot table. There is a requirement to change the font color of an expression using a expression. If the expression has value No then RED other wise BLACK. But this is changing the color of the header (for that dimension) as well . Please find below the screen shot of the issue.
Could you please let me know how to resolve this?
Regards,
Murali
Accepted Solutions
- Mark as New
- Bookmark
- Subscribe
- Mute
- Subscribe to RSS Feed
- Permalink
- Report Inappropriate Content
Hi Shubhu,
This did not work for me.
I got a confirmation that this is bug. So have to live with it. Lets hope they are going to fix this soon.
Regards,
Murali
- Mark as New
- Bookmark
- Subscribe
- Mute
- Subscribe to RSS Feed
- Permalink
- Report Inappropriate Content
Murali,
your problem was discussed several times here in the forum and it seems to be either a bug or a design flaw.
I found this thread a good summary of the discussions:
http://community.qlik.com/thread/8035?start=0&tstart=0
There is also a workaround stated using visual cues, AFAIK this will work only with numericals.
Sorry for no better help,
Stefan
- Mark as New
- Bookmark
- Subscribe
- Mute
- Subscribe to RSS Feed
- Permalink
- Report Inappropriate Content
Hi Murali,
does the chart have to be a pivot table? if you use a straight table instead the header will remain the default colouring
thanks
Joe
- Mark as New
- Bookmark
- Subscribe
- Mute
- Subscribe to RSS Feed
- Permalink
- Report Inappropriate Content
try this
=if(MinString(C) = 'no', Red(), if(MinString(C) = 'yes', Blue(), Yellow()))
here C is field name but use full expression.
Reg,
Shubhu
- Mark as New
- Bookmark
- Subscribe
- Mute
- Subscribe to RSS Feed
- Permalink
- Report Inappropriate Content
Hi Shubhu,
This did not work for me.
I got a confirmation that this is bug. So have to live with it. Lets hope they are going to fix this soon.
Regards,
Murali