Unlock a world of possibilities! Login now and discover the exclusive benefits awaiting you.
- Qlik Community
- :
- All Forums
- :
- QlikView App Dev
- :
- Line Chart question
- Subscribe to RSS Feed
- Mark Topic as New
- Mark Topic as Read
- Float this Topic for Current User
- Bookmark
- Subscribe
- Mute
- Printer Friendly Page
- Mark as New
- Bookmark
- Subscribe
- Mute
- Subscribe to RSS Feed
- Permalink
- Report Inappropriate Content
Line Chart question
Hi,
Hope somebody has a tip for me in this case.
I have a simple line graph chart in qvw-document. It is about sales per salesperson per month. As you can see from data we don't have sales line in datamodel (table1) for "Salesperson 1" in May. This means that he has sold 0 in that month even though we don't have any line's in datamodel where we can calculate this 0 as a sum.
In linechart the line just goes from april to june and it seems that this salesperson has sold something in may too - even though there are not dot as a symbol for him in that month. But anyway, this may cause some misunderstandings.
So, is there a possibility to draw this graph so that line would go to 0 for salesperson 1 in May? In the attached qvw I have solved this by adding a 0 line to datamodel. In my real case this is not possible, too many dimensions and then of course our green-gray-white codes in selection lists would not work.
This is definitely not the real case. I just attached a very simple example here to simulate my problem.
If any questions, please ask.
Thanks,
Teppo
- Mark as New
- Bookmark
- Subscribe
- Mute
- Subscribe to RSS Feed
- Permalink
- Report Inappropriate Content
In the "Chart Properties" on the "Presentations" and check "Hide zeros."
- Mark as New
- Bookmark
- Subscribe
- Mute
- Subscribe to RSS Feed
- Permalink
- Report Inappropriate Content
hi,
try this
C u,
Stefano
- Mark as New
- Bookmark
- Subscribe
- Mute
- Subscribe to RSS Feed
- Permalink
- Report Inappropriate Content
That will not work. There is no value for month '5' for 'SalesPerson 1' therefore the chart can not calculate a value.
Month 5 needs to be associated in some way to SalesPerson 1. i.e there needs to be at least 1 row of data for SalesPerson 1 with a month of 5. The sales value could be Null, blank or zero.
Jay
Edit: My coment about it not working was in response to Washington.
- Mark as New
- Bookmark
- Subscribe
- Mute
- Subscribe to RSS Feed
- Permalink
- Report Inappropriate Content
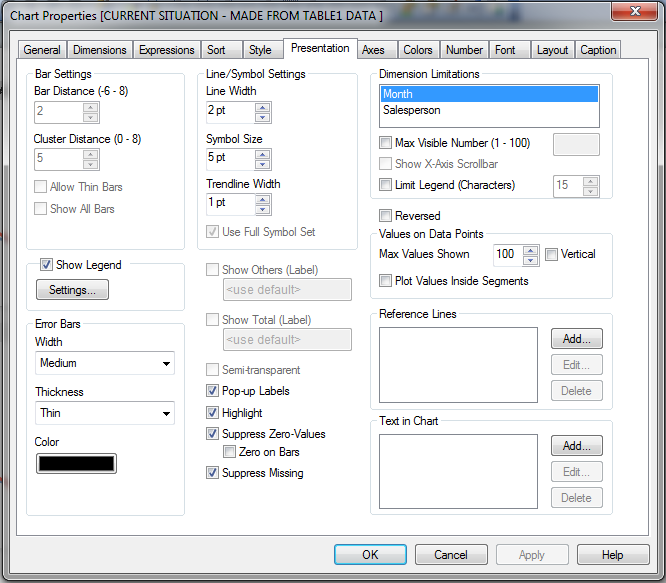
I have tried all those checkboxes, but no help. I didn't find exactly "Hide zeroes" option. My Presentation tab looks like this.
- Mark as New
- Bookmark
- Subscribe
- Mute
- Subscribe to RSS Feed
- Permalink
- Report Inappropriate Content
Thanks.
One more question 
If I have 10 different dimensions in this chart (cyclic group), do I have to do this script-logic to each of them?
Teppo
- Mark as New
- Bookmark
- Subscribe
- Mute
- Subscribe to RSS Feed
- Permalink
- Report Inappropriate Content
Ok,
I just wanted to have a confirmation that this has to be solved in datamodel, if we really want to solve this. I tried to build all kind of set analysis etc to expression so that data would have been some how calculated. But of course no luck.
Maybe it would be a good new functionality to QV, where we could give a "default value" to these "points" where are no data in datamodel.
Thanks,
Teppo
- Mark as New
- Bookmark
- Subscribe
- Mute
- Subscribe to RSS Feed
- Permalink
- Report Inappropriate Content
Changes file follows.
- Mark as New
- Bookmark
- Subscribe
- Mute
- Subscribe to RSS Feed
- Permalink
- Report Inappropriate Content
Hi,
i think u should do this only on the dimension before month if u not use that dimension on x assys of an other graph.
In this case u have tha same problem and u have to do the "join" with an other one dimension before.
I hope to be clear.
C u,
Stefano
- Mark as New
- Bookmark
- Subscribe
- Mute
- Subscribe to RSS Feed
- Permalink
- Report Inappropriate Content
Hi Toa
I think your best bet is to ensure in your load script that there is always ay least one rederence to each salesperson, even if that means adding a dummy sales of 0 value to the fact table. Something like:
Concatenate (TransactionTable)
LOAD 0 AS SalesVolume,
0 AS SalesAmount,
SalespersonID
FROM SalespersonMaster;
Assuming that all the sales person IDs or names exist in some sort of master table/file.
Hope that helps
Jonathan