Unlock a world of possibilities! Login now and discover the exclusive benefits awaiting you.
- Qlik Community
- :
- All Forums
- :
- QlikView App Dev
- :
- Static Max for graph axis
- Subscribe to RSS Feed
- Mark Topic as New
- Mark Topic as Read
- Float this Topic for Current User
- Bookmark
- Subscribe
- Mute
- Printer Friendly Page
- Mark as New
- Bookmark
- Subscribe
- Mute
- Subscribe to RSS Feed
- Permalink
- Report Inappropriate Content
Static Max for graph axis
Hi All,
I have just started to work with QV and I was hoping that somebody could help me with the following problem:
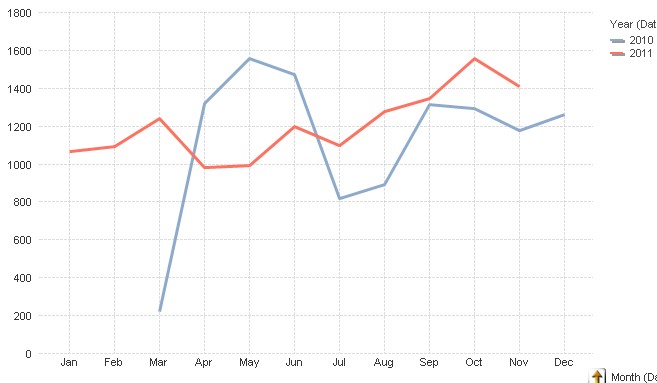
I have created a graph which displays some stats per month per year. So far that was pretty easy however now I am running into the following issue. For reporting purposes I want the axis of that graph to be static rather then vary with the month/day that I have selected since that is confusing to my users.
Just setting a fixed value for Static Max doesn't work for me since on month/year level my results are X times higher then on day level so if I set the static max to 1800 for example the top level of my graph shows nicely but if I zoom into the days the same scale is used for the axis and thus I cannot see the variations that well since the graph almost runs on the "zero" line.
So far I have managed to get a partial solution from another topic which is the following:
=if(GetCurrentField(TimeDim) = 'Month (Date)',1800,
if(GetCurrentField(TimeDim) = 'Day(Date)',60))
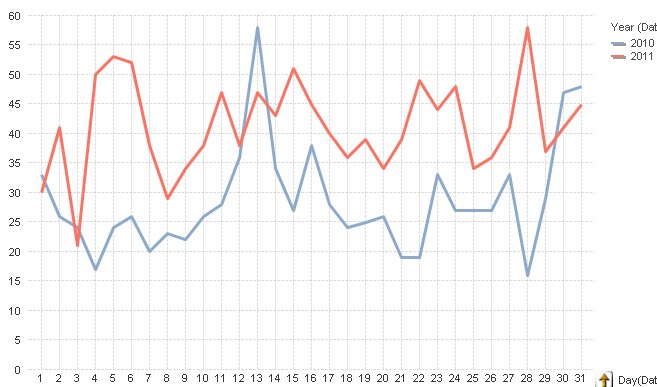
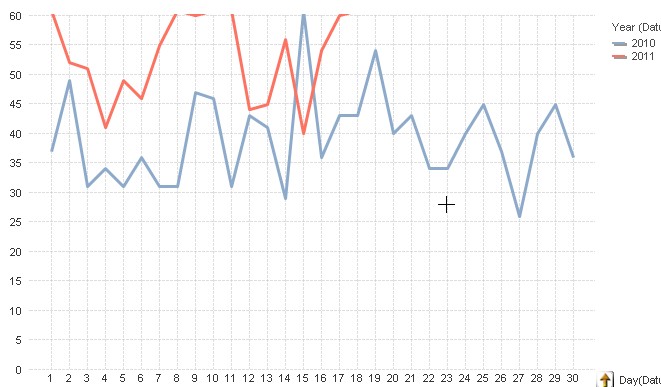
This allows me to set a different scale for the "Day" dimension. However occasionally a value on a particular day might peak to 160. So what I am looking for is a way to have the second value (60) variable based on the maximum value that occurs in that particular month. So e.g. if the highest value is below 100 have the scale set at 100. If the highest value is above 100 the scale should be set to 200.
Below are 3 screenshots to help clarify things. The first screenshot are the stats per month, per year. In the second screenshot I have zoomed in to Aug. The 3rd screenshot is taken from November. As you can see part of the graph is not shown since the values are higher then 60.
Thanks in Advance for your assistance!
Regards,
Niels
Accepted Solutions
- Mark as New
- Bookmark
- Subscribe
- Mute
- Subscribe to RSS Feed
- Permalink
- Report Inappropriate Content
Hi Niels,
I think something like this should work (it does at my place):
=if(GetCurrentField( Grp_YQZB ) = 'Quarter',500000,
if(GetCurrentField( Grp_YQZB ) = 'YearMonth',if(max(aggr(sum(Amount),YearMonth))>30000, 60000,30000)))
sum(Amount) is my expression to plot and I'm aggregating over YearMonth dimension and looking for the max aggregated value, then decide which static axis limit to chose.
Hope this helps,
Stefan
- Mark as New
- Bookmark
- Subscribe
- Mute
- Subscribe to RSS Feed
- Permalink
- Report Inappropriate Content
Hey Stefan,
Thanks for your answer. After some small tweeking I now have exactly what I want.
Regards,
Niels